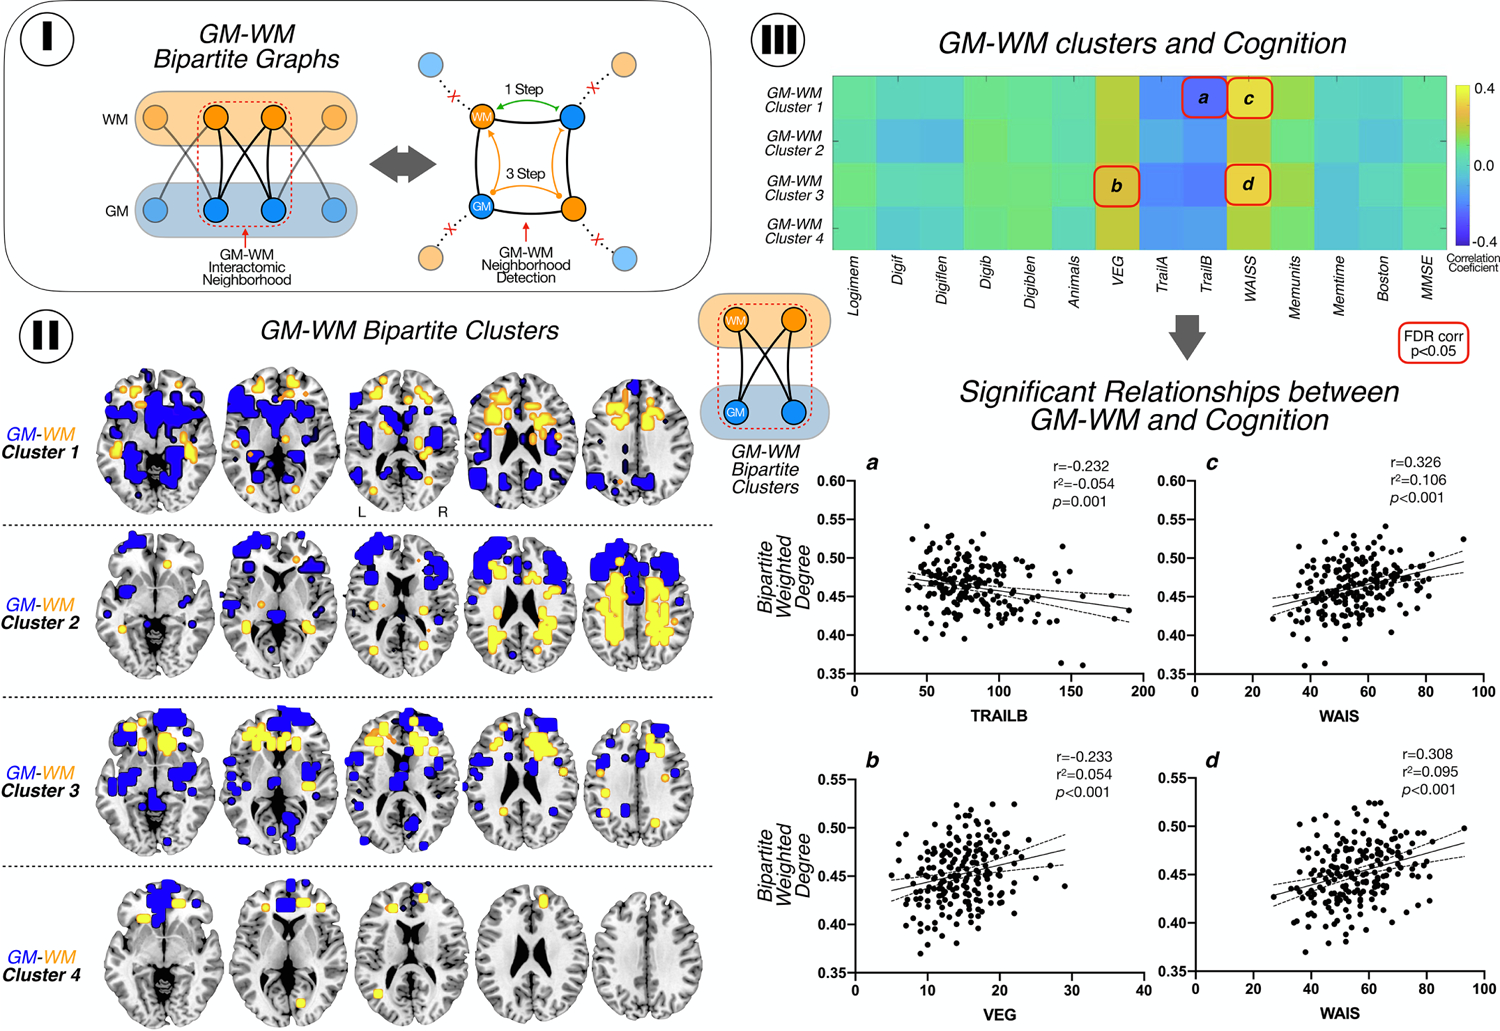
Figure 3.

GM-WM Bipartite Interactions and Modularity. I. GM-WM bipartite graphs: we computed the network distances between all bipartite graph nodes (left). Then, we identified quadrangle motifs by selecting nodes that connects to other nodes directly (1-Step connectivity), and indirectly in 3-steps (right). II. Location of modules of GM (blue) and WM (yellow) interconnected. III. Pearson correlation matrix between modules and cognitive test. We found a negative correlation with trail B and module 1 and positive correlations between module 1 and 3 and WAIS-R; and between VEG and module 1. The correlations are shown with 95% confidence interval. Logimem: Logical memory immediate; Digitf: digit spam forward total number of trial correct; Digitflen: Digit spam forward length; Digitb: digit spam backward total number of trial correct; Digitblen: Digit spam backward length; Animals: Category fluency test animals; VEG: Category fluency test vegetables; Trail A: Trail making test part A; Trail B: Trail making test part B; WAIS: WAIS-R Digit Symbol; Memunits: Logical memory delayed, units recall; Memtime: time between logical memory test; Boston: Boston naming test; MMSE: MiniMental State Exam.
