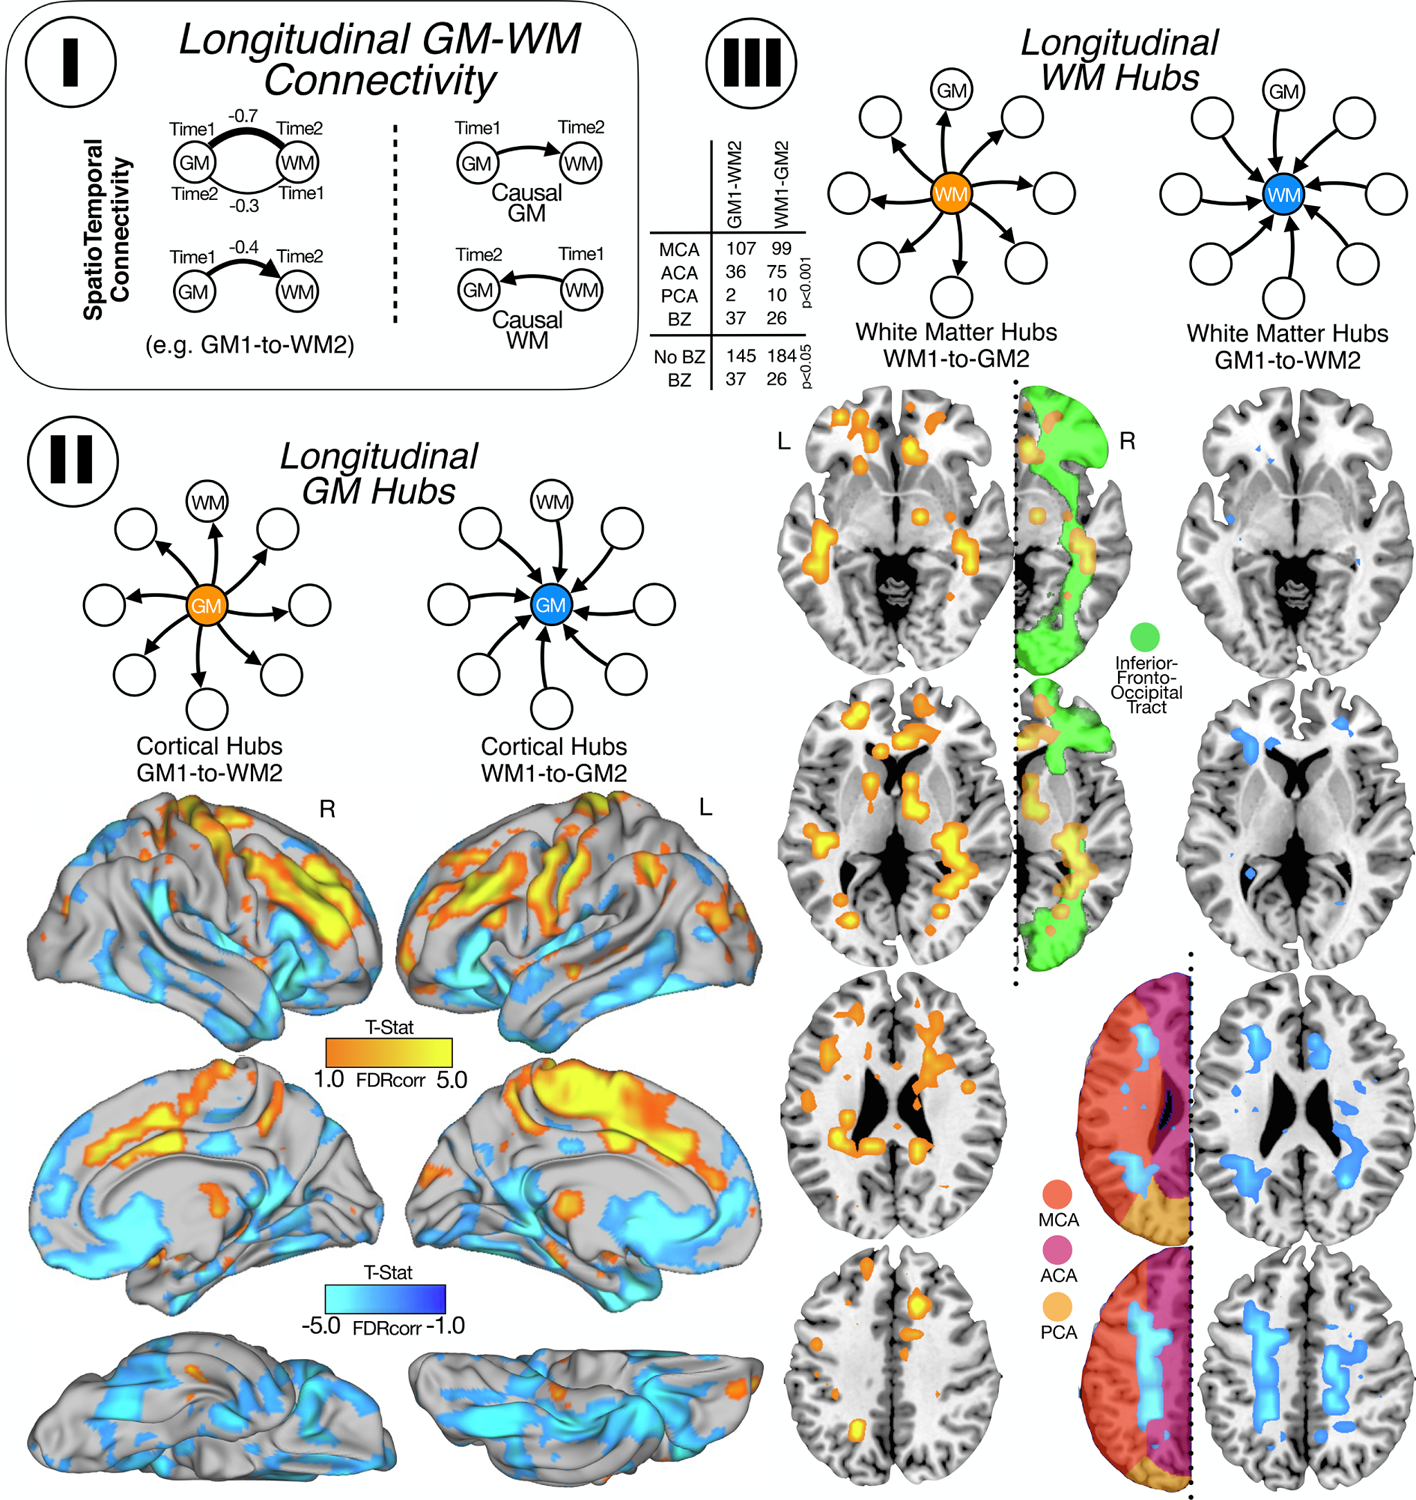
Figure 4.

Longitudinal GM-WM connectivity. I. First, we calculate the weighted degree for GM and WM in time 1 and in time 2. We subtracted the correlations (time 1 minus time 2) and obtained maps for GM and WM. Those regions with positive correlations mean that the causal relationships go from time 1 to time 2 and negative correlations mean the causal relationship go from time 2 to time 1. II. Cortical maps for GM hubs: in orange (positive correlations) are shown the cortical areas that lead to secondary degeneration of the WM and in blue (negative correlation) are shown the cortical areas secondary degenerated due to the presence of WM lesions. III. WM maps for WM hubs: in orange (positive) are shown the WM zones that cause degeneration in the GM, mostly located in the inferior front occipital tract and in blue (negative) are shown the WM areas affected by primary vascular damage from GM, mostly border zone between MCA and ACA. For GM and WM maps, we show the statistically significant weighted-degree t-statistic maps.
