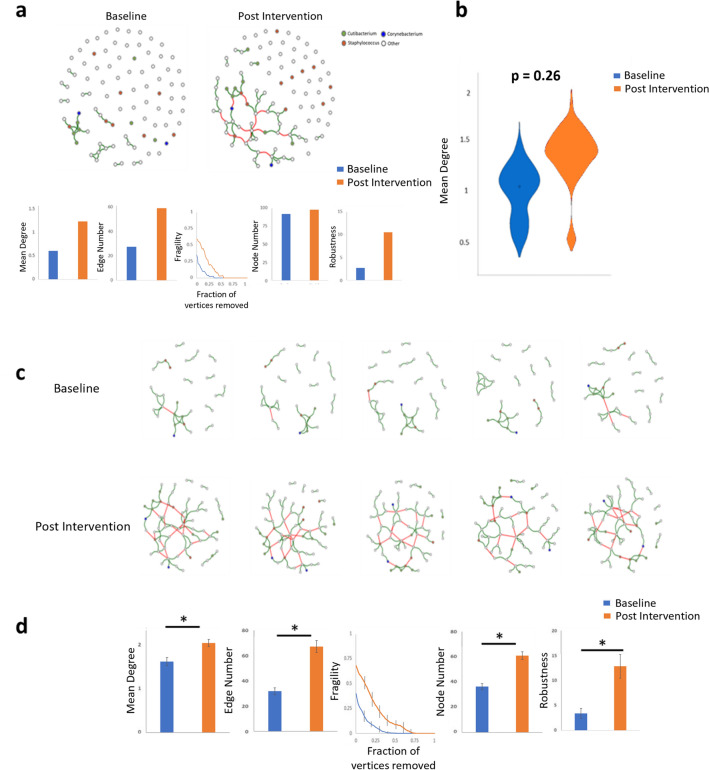
Figure 4.
Community co-occurrence network analysis. (a) Average community networks for all samples at baseline and following 5 weeks of application, with associated network metrics. (b) Example statistical analysis of network mean degree metric following bootstrapping between samples at baseline and post intervention. No metrics used showed differences between pre- and post-application using average network approaches. (c) Selected indicative examples of single sample network from individual subject at baseline and post intervention. (d) Network analysis metrics between networks at baseline and post intervention.

