
Figure 3. Consequences of PTE on the NAc transcriptome and affected biological pathways.
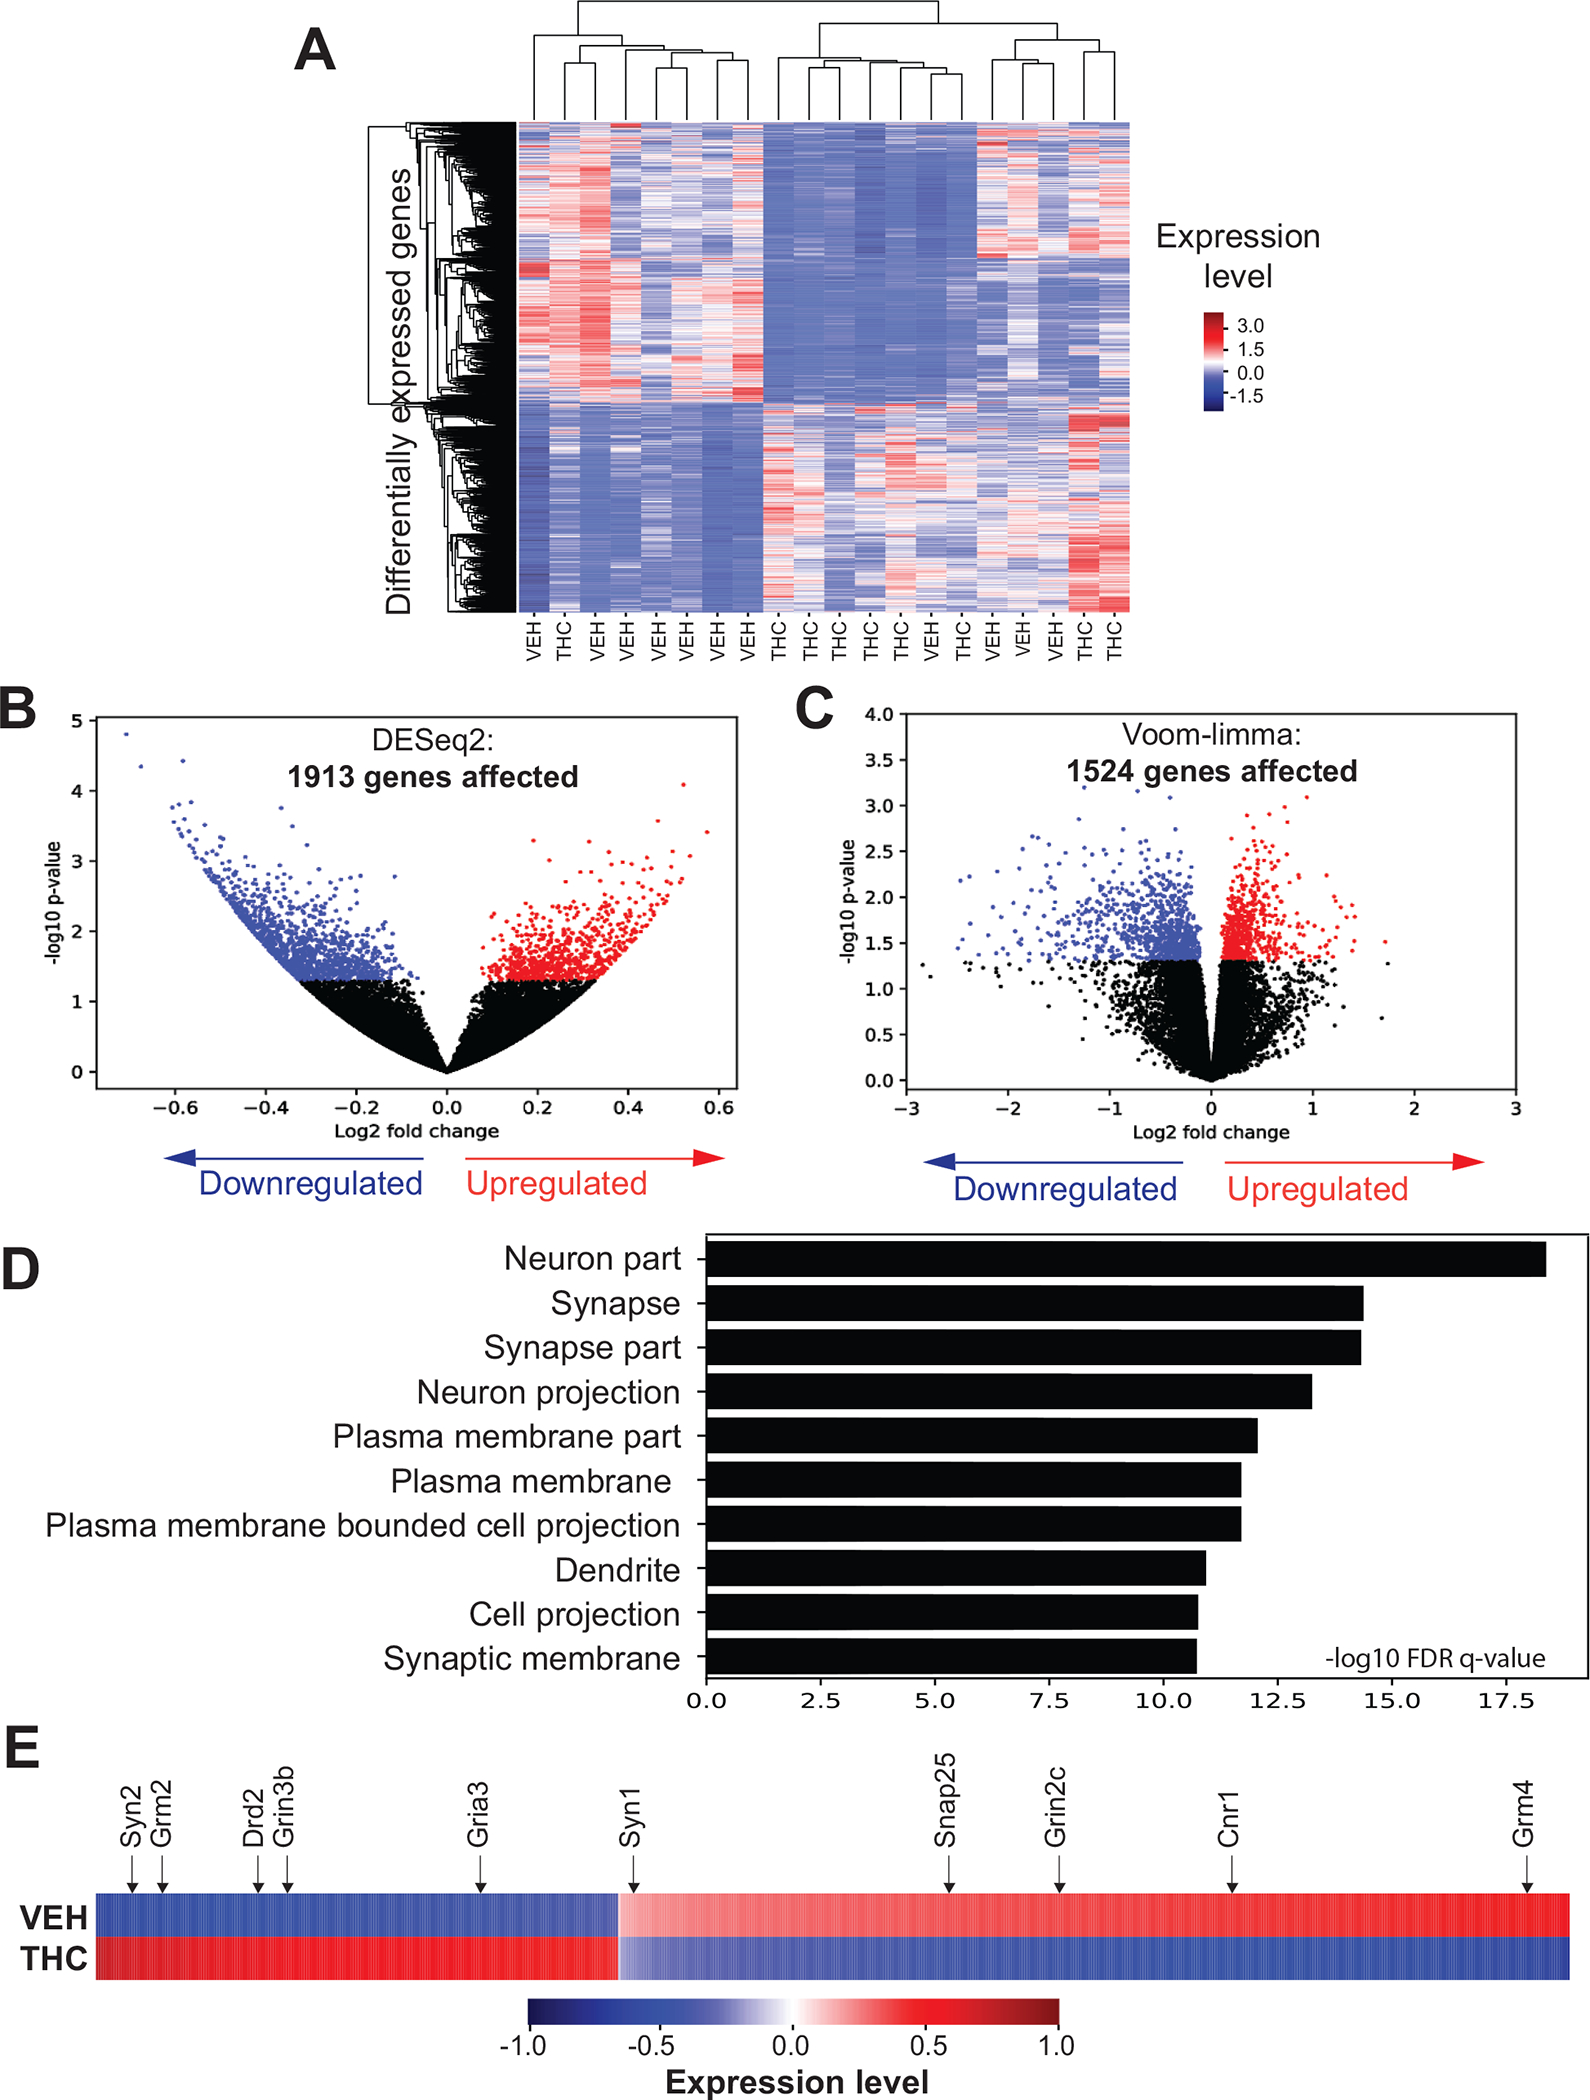
(A) Hierarchical clustering of RNA-seq reads for all DEGs (vertical dimension) and samples (horizontal dimension), PND62. (B, C) Distribution of DEGs obtained using the DESeq2 and Voom-limma analysis tools. Each dot corresponds to a single gene; colors indicate significant up-(red) or down-(blue) regulation. (D) Gene ontology analysis using GOrilla on DEGs shared by the DESeq2 and Voom-limma analyses; graph represents the top 10 categories within “cellular component”. (E) Heatmap showing changes in the RNA expression level of DEGs within the above top 10 categories. Arrows point to several interesting genes involved in synaptic regulation.