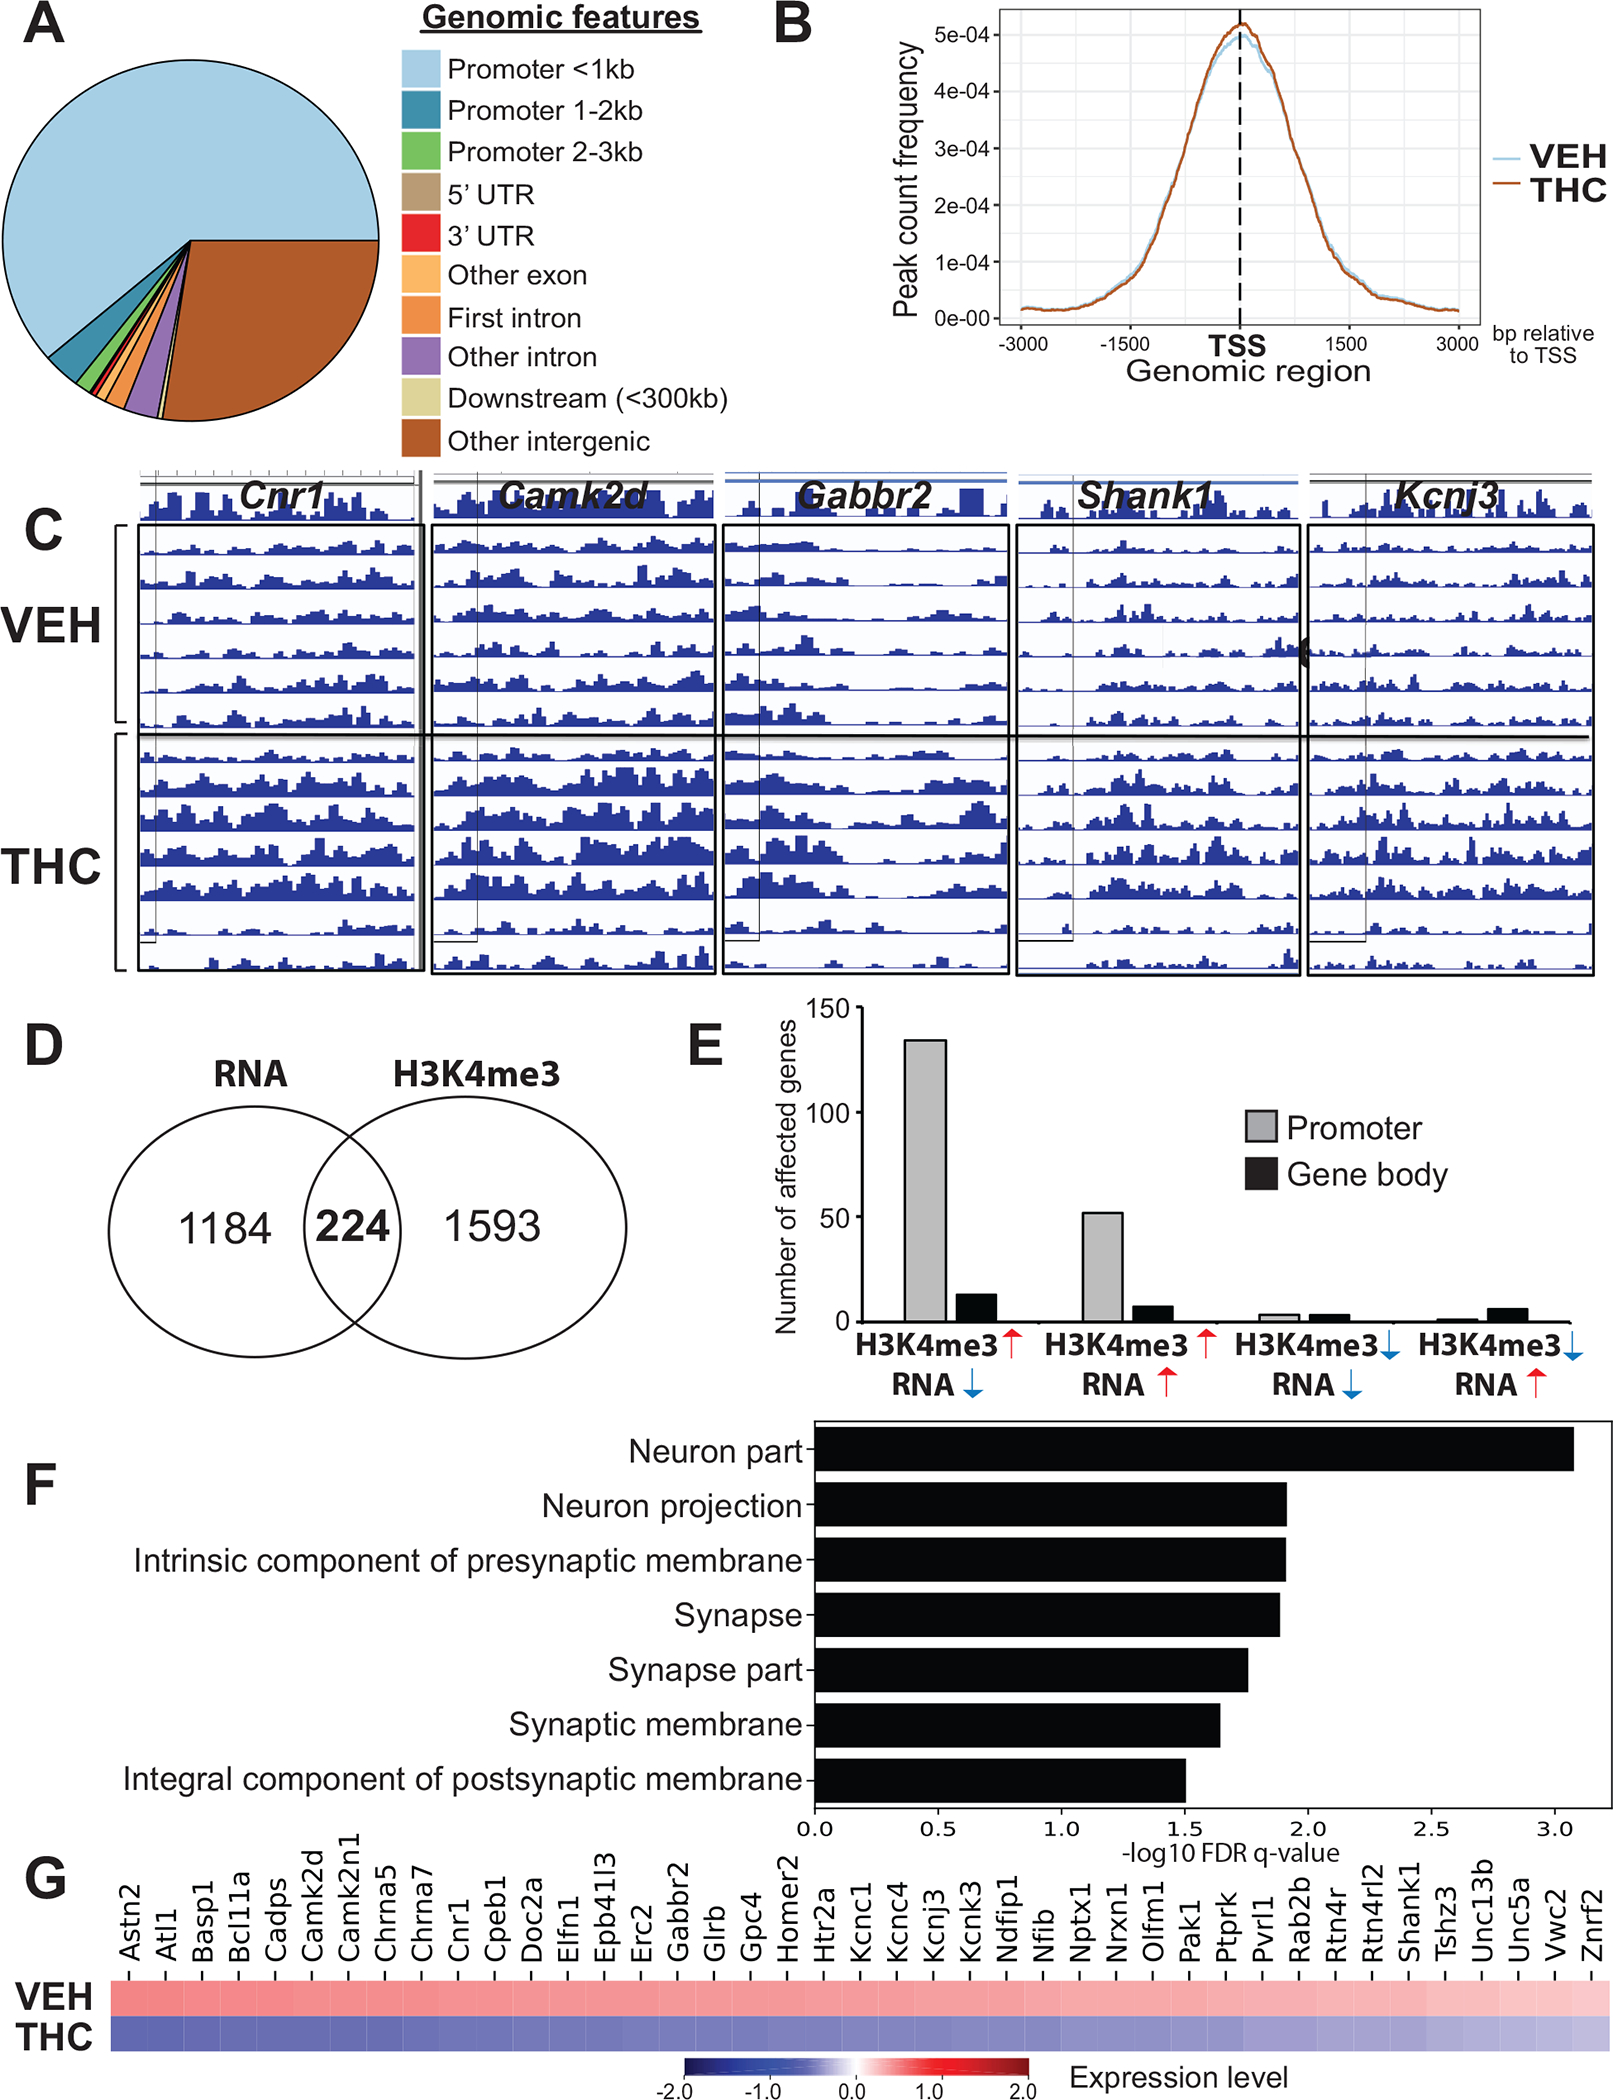
Figure 4. PTE changes the epigenomic profile of the NAc at gene loci functionally relevant to the regulation of synaptic plasticity.

(A) Enrichment of different genomic features within chromatin domains affected by THC. N=6–7/group. (B) No significant THC-related shift in the distribution of H3K4me3 peaks relative to the transcriptional start sites of affected genes. (C) ChIP-seq peaks for five genes related to cannabis and synaptic neurobiology. Individual rows correspond to samples within the VEH and THC groups. (D) Comparison between genes affected on the mRNA (RNA-seq) and H3K4me3 (ChIP-seq) level. Numbers inside the Venn diagram indicate altered expression regardless of direction of change. (E) Relationship between mRNA transcript and H3K4me3 level changes at different gene loci. Note the higher abundance of affected promoters vs. coding regions. (F) Gene ontology analysis on “H3K4me3 up/RNA down”; graph represents the top 10 “cellular component” categories and heatmap (G) showing the affected genes.
