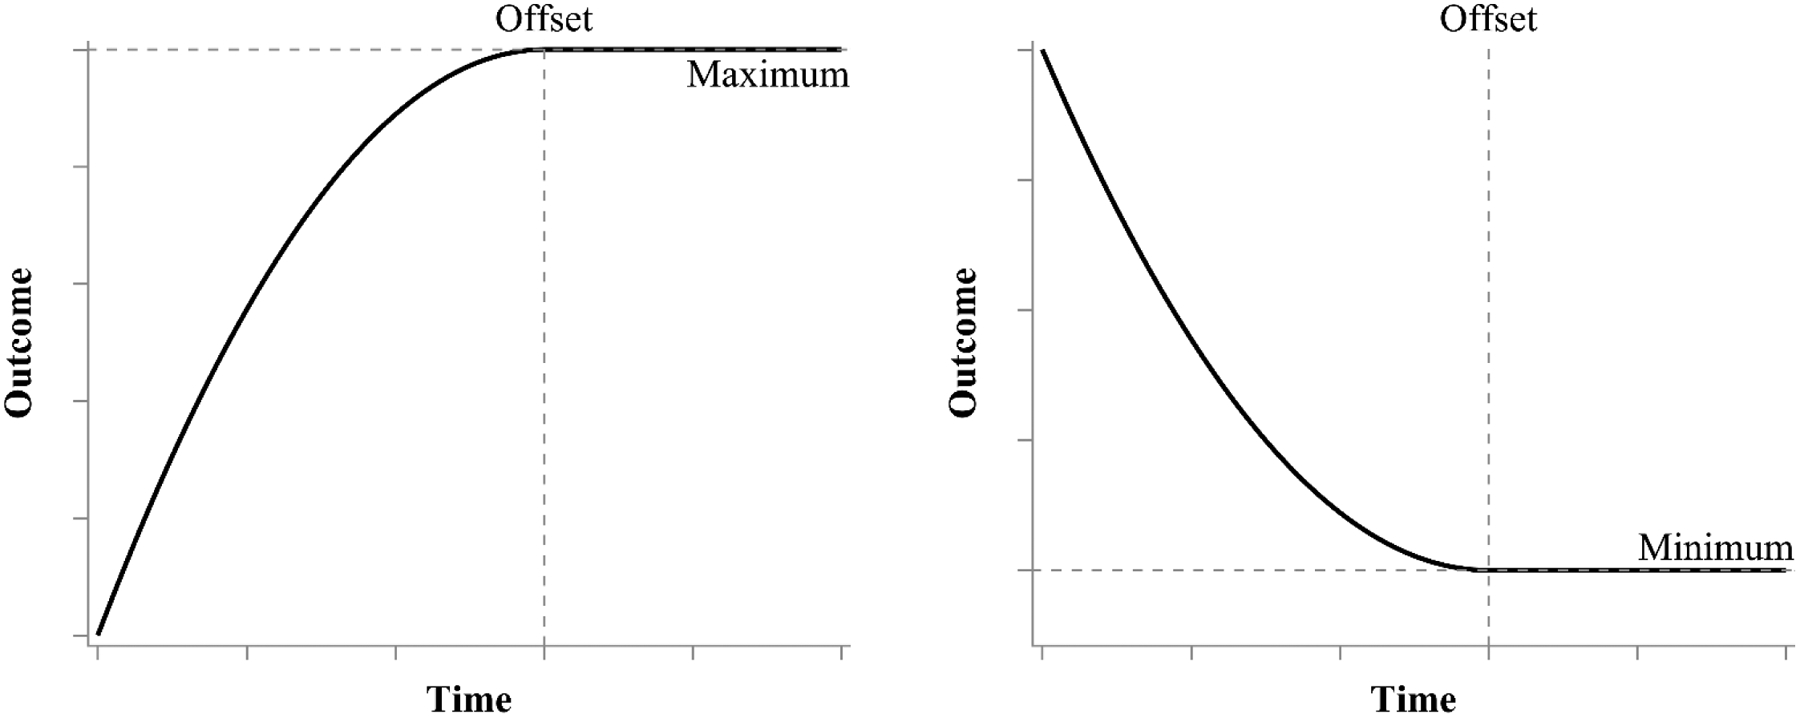
Figure 3.

Hypothetical plot of a time-at-offset process growing towards a maximum value (left) and a time-at-offset process decaying towards a minimum value (right). Prior to the change offset, the growth trajectory follows a quadratic function. Once reaching the change offset, which is defined as the extremum of the quadratic function, the growth trajectory becomes a horizontal line at the maximum or minimum value of the quadratic function.
