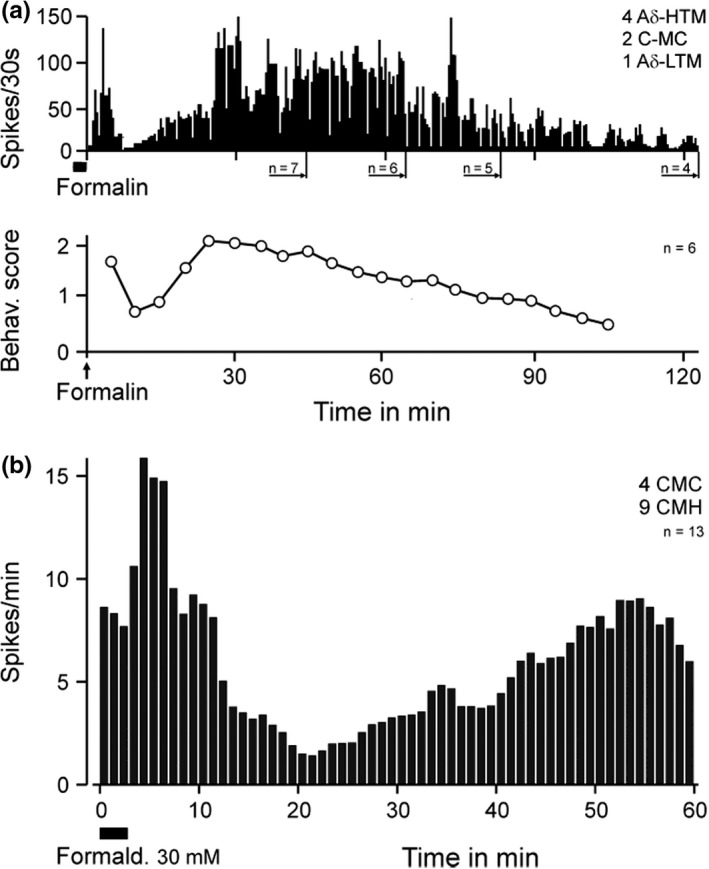
FIGURE 3.

Two phases of rat single‐fiber activity in vitro and behavioral correlate. (a) Averaged fiber activities of a sample of receptive fields exposed for 3 min to formaldehyde 30 or 100 mM; falling number of units due to action potentials sinking into background noise. Lower panel (after Kocher, 1988) showing mean time course of pain‐related behaviors (shaking, licking, biting) after formalin (2.5%) injection in Wistar rats; cross‐correlation in 5 min bins provided R = 0.67 (p = 0.0185, product‐momentum correlation). (b) Averaged rat fiber activity starting with uniform formaldehyde 30 mM application to receptive fields of only polymodal C‐fibers
