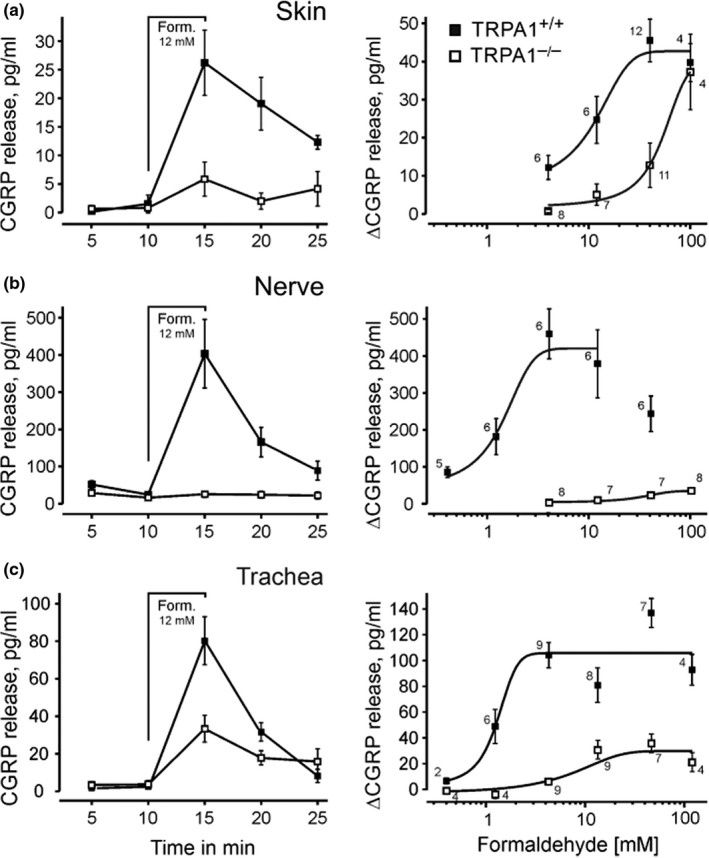
FIGURE 7.

Formaldehyde‐evoked iCGRP release from isolated tissues of TRPA1–/– and WT littermates. Time course of CGRP release in (a) hindpaw hairy skin, (b) desheathed sciatic nerve, and (c) trachea; the five‐minute stimulation period with formaldehyde (Form. 12 mM) is indicated. Right panels summarize the formaldehyde concentration‐response curves; sigmoidal functions are fitted to the increases in CGRP release. The numbers of identical experiments are given for each data point. Means and standard errors are visualized
