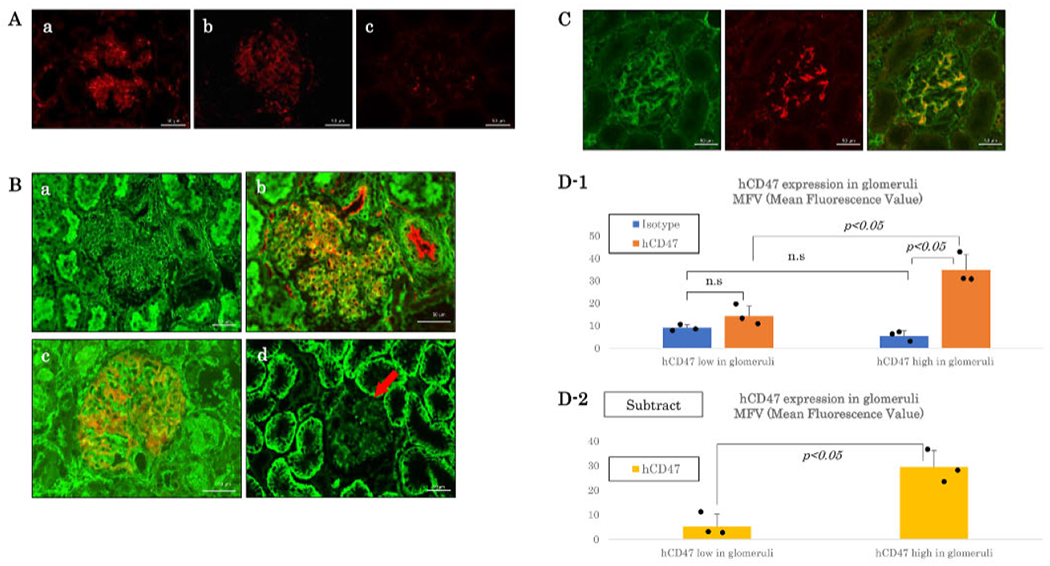
FIGURE 1.

Glomerular and/or Tubular hCD47 expression pattern in hCD47Tg GalT-KO kidneys in Groups A, B and C. (A) Immunofluorescence staining of hCD47 (red) in hCD47Tg GalT-KO kidneys in Group A. (a) High hCD47 expression on glomeruli and peritubular capillaries (red) of Baboon # 12P86’s donor kidney, (b) Weak expression of hCD47 only in glomeruli (red) of Baboon # 14P9’s donor kidney (c) hCD47 expression in a GalT-KO pig kidney as the control. Bar: 50 μm. (B) Immunofluorescence staining of hCD47 (green) in GalT-KO/hCD47 kidneys in Groups B and C. (a) hCD47 expression was high in both tubular and glomerular cells of # 2415’s (Group B). Donor kidney, (b) Double staining of hCD47 (green) and CD31 (red) in # 2415’s (Group B) donor kidney, (c) Double staining of hCD47 (green) and Nephrin (red) (contra lateral kidney from the # 2415’s). (d) hCD47 expression was high in renal tubular cells with weak/no hCD47 expression on glomerular cells (red arrow) (# 13P60’s donor kidney. Group C). (C) hCD47 (green), Nephrin (red), and merged images of naive baboon kidneys showing high expression hCD47 in the podocytes of the glomerular cells with a feeble expression on renal tubular cells. Bar: 50 μ m. (D) Quantitative analysis of hCD47 in glomeruli of donor kidneys. D1: Average ± SD of MFVs of isotype controls and hCD47 in glomeruli (n = 3, each). D2: MFVs of isotype controls were subtracted from MFVs of hCD47. The dots in the figure D1 and D2 indicate each value. The two-sided Student’s t-test was used
