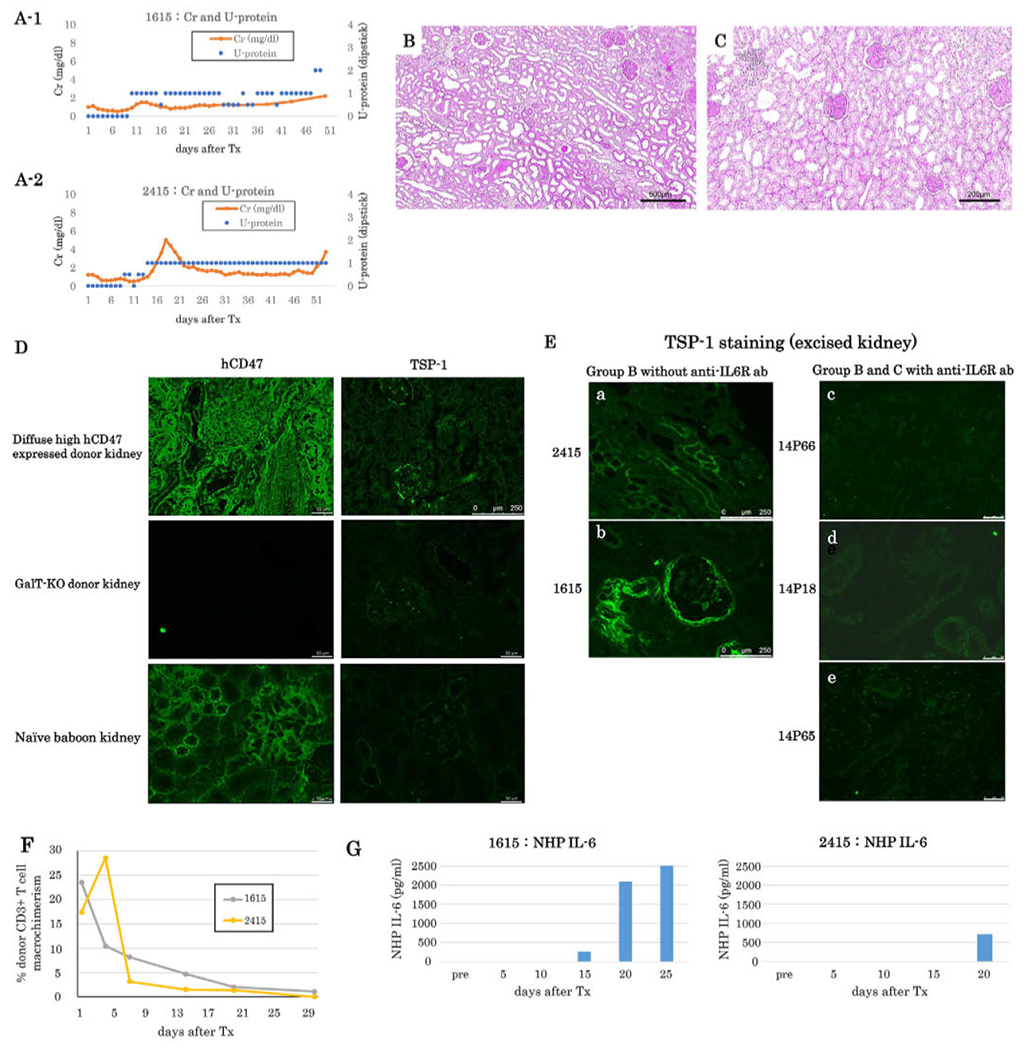
FIGURE 2.

(A) sCr (orange lines) and urine protein (blue dots) of baboons following K+VT XTx in Group B (A-1: #1615, A-2: #2415). Proteinuria did not exceed 2+ except for the last two days in baboon #1615. (B) Excised graft kidney of #1615 showing interstitial cell infiltrates and glomerular changes (PAS, Bar: 500 μm). (C) Excised graft kidney of #2415 showing less interstitial cell infiltrates (PAS, Bar: 200μm. (D) hCD47 and TSP-1 expression under untreated normal condition in GalT-KO/hCD47 pig kidney (top left: hCD47 staining; top right: TSP-1 staining), GalT-KO without hCD47 Tg pig kidney (middle left: hCD47 staining; middle right: TSP-1 staining) and naïve baboon kidney (bottom left: hCD47 staining; bottom right: TSP-1 staining). TSP-1 was weakly positive in GalT-KO/hCD47 high pig kidney (Top right), while others did not show TSP+ cells. Bar: 50 μm. top right 250 μm. (E) TSP-1 expression in excised kidney graft tissue; a #2415 and b #1615 in Group B Without anti-IL6R Ab treatment (Bar: 250 μm), c #14P66 and d #14P18 in Group B with anti-IL6R ab treatment, and e; #14P65 in Group C with anti-IL6R Ab treatment. (Bar: 50μm). In Group B without anti-IL6R Ab treatment, both excised graft kidneys of #2415 and #1615 had upregulation of TSP-1 (a and b), while no TSP-1 upregulation was observed in kidney grafts of 14P66, 14P18, and 14P65 that were treated with anti-IL6R Ab. (F) The percentage of peripheral blood macrochimerism (pig CD3 positive T cells) of #1615 (gray line) and #2415 (yellow line) in Group B following K-VT XTx. (G) IL-6 concentration assessed by ELISA in the sera of Group B baboons (left: #1615, right; #2415). Both baboons had a high IL-6 concentration between POD 15 and 25
