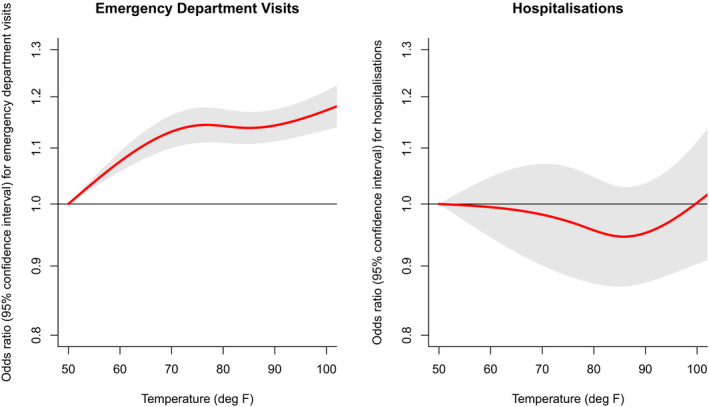
FIGURE 1.

Odds ratio (ORs) and 95% confidence intervals of emergency department visits and hospitalisations associated with daily maximum temperature, relative to the reference temperature (50°F), cumulative over lag days 0–5 [Colour figure can be viewed at wileyonlinelibrary.com]
