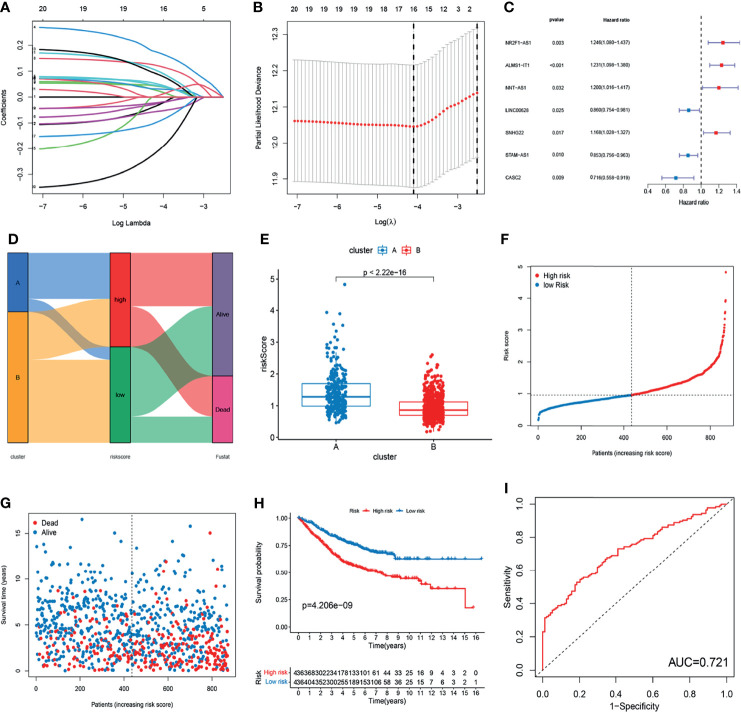
Figure 4.
Construction of m6A- and m5C-related lncRNA signature using the training set. (A, B) LASSO regression analysis and partial likelihood deviance of prognostic lncRNAs. (C) Forest plot of multivariate cox regression analysis of prognostic lncRNAs. (D) Alluvial diagram of subtypes distribution in groups with different risk score and survival outcomes. (E) Correlation between the two subtypes and the different risk scores of the signature. (F, G) The ranked dot plot indicates the risk score distribution and scatter plot presenting patient survival status. (H) KM analysis of overall survival (OS) between the two groups. (I) Receiver operating characteristic (ROC) curve of the m6A- and m5C-related lncRNA signature.

