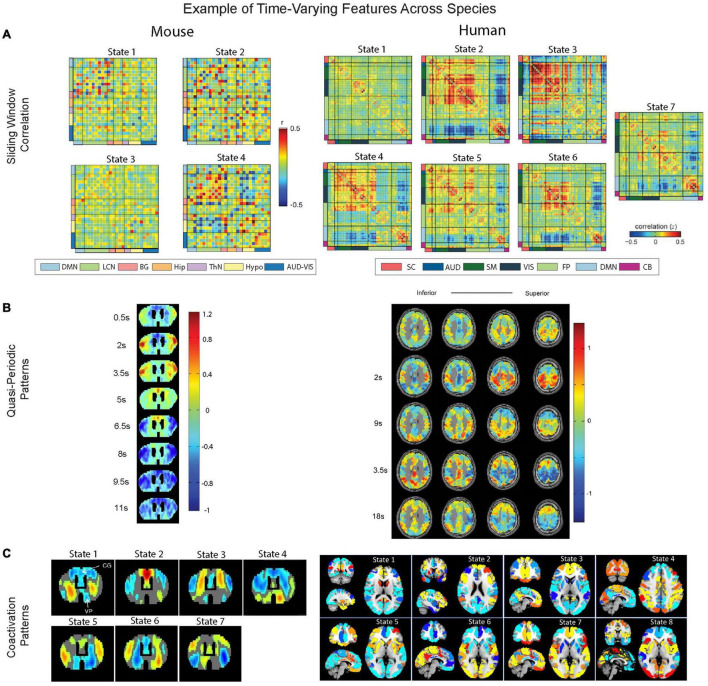
FIGURE 4.
Overview comparison of windowed approaches, quasi-periodic patterns, and coactivation patterns. (A) Distinct brain states revealed by sliding window correlation are from Tsurugizawa and Yoshimaru (2021) for mice (left) and from Allen et al. (2012) for human brains (right). Mice networks (left) include DMN (light blue), lateral cortical network (LCN, light green), audio-visual network (AUD-VIS, dark blue), subcortical basal ganglion (BG, coral), hippocampus (Hip, orange), thalamus (ThN, light purple), and hypothalamic network (Hypo, light yellow). For humans (right), a similar set of color codes indexing networks that are homologous to the mice counterparts are also added to the figure. Specifically, human networks (right) include DMN (light blue), frontoparietal (FP, light green), somatomotor (SM, dark green), auditory (AUD, blue), visual (VIS, dark blue), subcortical (SC, light red), and cerebellar (CB, violet). Note that the central executive network, which is known as FP in humans, is referred to as LCN network in mice (Gozzi and Schwarz, 2015). (B) The quasi-periodic patterns and their correlation with the whole brain images across time are from Belloy et al. (2018a) for mice (left) and from Majeed et al. (2011) for humans (right). (C) Brain states determined by coactivation patterns are from Adhikari et al. (2021) for wild-type mice (left) and from Janes et al. (2020) for human brains (right).

