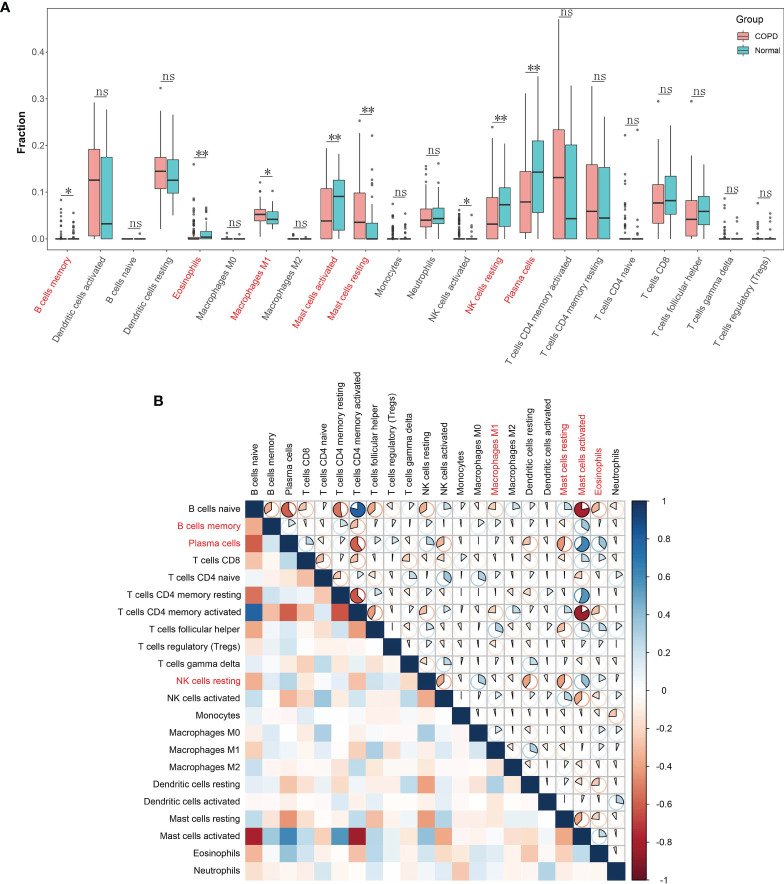
Figure 6.
Landscape of immune cell infiltration in chronic obstructive pulmonary disease. (A) Boxplot of the proportion of 22 types of immune cell infiltrates. Red in the boxes represents the chronic obstructive pulmonary disease group and blue represents the normal group. *P < 0.05; **P < 0.01; ns, not significant. (B) Heatmap plot of correlations among 22 types of immune cells. Blue and red indicate positive and negative correlation, respectively. The darker the color the stronger the correlation.

