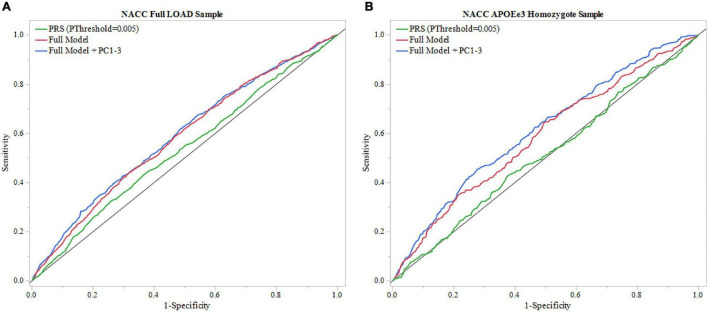
FIGURE 4.
ROC analysis of PRS and full model in NACC. Receiver operating characteristic (ROC) curves were used to assess diagnostic ability, with the Area Under the Curve (AUC) providing a quantitative measure. The models illustrated are PRS (PThreshold = 0.005) alone and the full model consisting of PRS (PThreshold = 0.005), age, sex, education, and APOEε4 allele count, and full model with principal components (Full Model + PC1-3). (A) Models using the entire NACC LOAD sample. Full model had greater results (AUC = 0.583) than PRS (PThreshold = 0.005) alone (AUC = 0.527). (B) Similar analysis was done in an APOEε3 homozygote sample to measure PRS effectiveness in a large dataset independent of APOEε4. Full model results were comparable to the full LOAD sample (AUC = 0.587), wheras PRS alone performed worse (AUC = 0.507).

