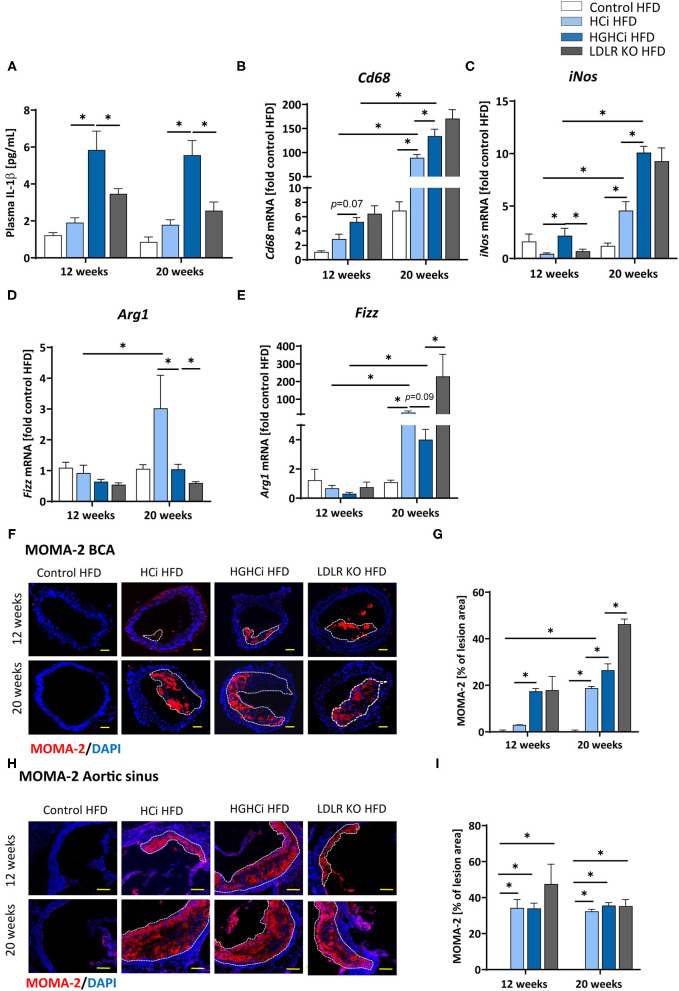
Figure 4.
Increased IL-1β plasma level and expression of pro-inflammatory markers in hyperlipidemic and hyperglycemic mice as compared to hyperlipidemic mice. (A) Plasma IL-1β [pg/mL] level at 12 and 20 weeks. (B–E) mRNA expression of macrophage polarization markers. M1 macrophage polarization is depicted by CD68 (B) and iNos (C) mRNA expression. Arg1 (D) and Fizz (E) mRNA expression levels are shown as M2 polarization marker. The data are presented as mean ± SEM and were normalized on the mean of two housekeeping genes (Hprt and B2m). HFD control served as reference and was set at 1. (F,G) Representative images showing immunofluorescence staining of truncus brachiocephalic arteries (BCA) sections for macrophage marker MOMA-2 (F, MOMA-2 = red; DAPI nuclear counterstain = blue; plaque region is circled with a white dashed line, scale bar 200 μm, 4 × magnification) and bar graphs summarizing data (G). Representative images showing immunofluorescence staining of cross-sections of aortic sinus for MOMA-2 (H, MOMA-2 = red; DAPI nuclear counterstain = blue; plaque region is circled with a white dashed line, scale bar 100 μm, 10 × magnification) and bar graphs summarizing data (I). Data presented as mean ± SEM and two-way ANOVA were performed with Sidak's multiple comparison post-hoc test (*p < 0.05). HFD control 12 and 20 weeks (N = 7), HCi HFD 12 and 20 weeks (N = 5), and HGHCi HFD 12 and 20 weeks (N = 6). Control HFD: Wild type mice without rAAV8-PCSK9D377Y injection on high fat diet (HFD); HCi HFD: rAAV8-PCSK9D377Y injection plus HFD (hyperlipidemic); HGHCi HFD: rAAV8-PCSK9D377Y and streptozotocin injection and HFD (hyperlipidemic and hyperglycemic).

