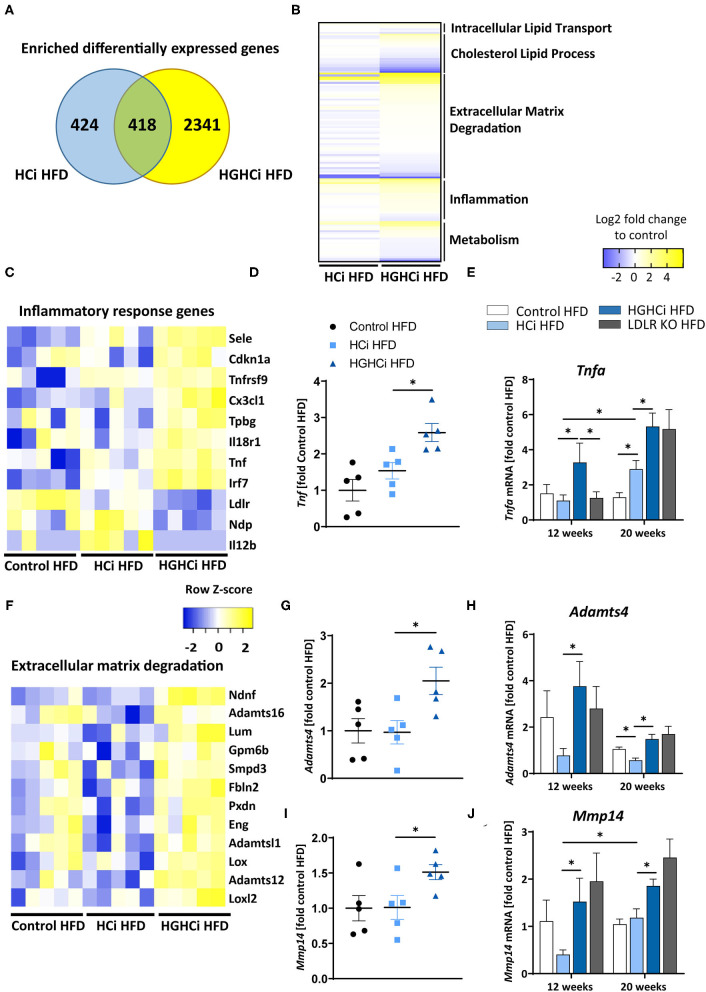
Figure 5.
Combined hyperglycemia and hyperlipidemia induce large set of differentially expressed genes and activates inflammatory response and extracellular matrix degradation pathways. RNA sequencing in aortic tissue of control HFD, HCi HFD and HGHCi HFD mice after 12 weeks. Wild type mice without AAV8-PCSK9D377Y injection on high fat diet (control HFD) or injected with rAAV8-PCSK9D377Y and on HFD (hyperlipidemic, HCi HFD) or injected with both rAAV8-PCSK9D377Y and streptozotocin and fed HFD (hyperlipidemic and hyperglycemic, HGHCi HFD). (A) Venn diagram showing overlap of genes significantly changed in HGHCi HFD or HCi HFD mice in relation to gene expression in control HFD mice. (B) Heat map summarizing differentially expressed gene (DEGs) identified by RNA sequencing and DEGs related biological processes using Gene Ontology and EnrichR analysis. (C) Heat map showing list of DEGs related to inflammatory response (GO: 0006954) using Gene Ontology and EnrichR analysis. (D) Tnf expression level (FPKM normalized on Control HFD) from RNASeq at 12 weeks (N = 5/ group) and its (E) qPCR validation in all groups at both time points (12 and 20 weeks). (F) Heat map showing list of DEGs related to extracellular matrix degradation pathways (GO: 0030198) using Gene Ontology and EnrichR analysis. RNA expression levels of selected ECM degradation genes Adamts4 (G,H) and Mmp14 (I,J) (FPKM normalized on Control HFD) from RNASeq at 12 weeks (N = 5/ group) (G,I) and its qPCR validation (H,J) in all groups at both time points (12 and 20 weeks). Gene count values larger than the average control are represented in yellow, while lower counts than the average control are represented in blue. Whenever transcript values are close to the control value, samples are colored in white. The data are presented as mean ± SEM and qPCR data were normalized on the mean of two housekeeping genes (Hprt and B2m). HFD control served as reference control. Two-way ANOVA was performed with Sidak's multiple comparison post-hoc test (*p < 0.05).

