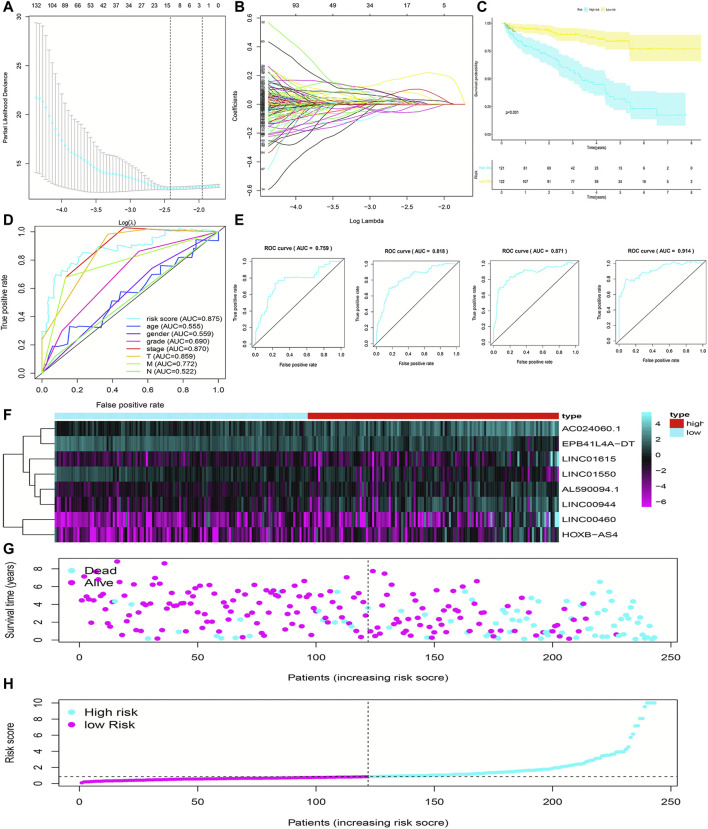
FIGURE 2.
Construction and evaluation of the FRlncRNA signature in training cohorts. The LASSO regression analysis was performed to avoid overfitting in training cohorts after univariate Cox regression analysis. LASSO coefficient values and vertical dashed lines were calculated at the best log(lambda) value (A) and LASSO coefficient profiles (B) of the prognostic-related lncRNAs were displayed. (C) K-M curves showed that the high-risk group had worse survival probability than the low-risk group in the training cohorts. (D) ROC curves for this signature and their AUC values in training cohorts. (E) ROC curves and their AUC values represented 1-, 3-, 5-, and 10-year predictions in training cohorts. (F) Heatmap of the eight FRlncRNA expression profiles showed the expression of FRlncRNAs in the high-risk and low-risk groups in training cohorts. (G) Scatter plot showed the correlation between the survival status and risk score of ccRCC patients. (H) Risk score distribution plot showed the distribution of high-risk and low-risk ccRCC patients.

