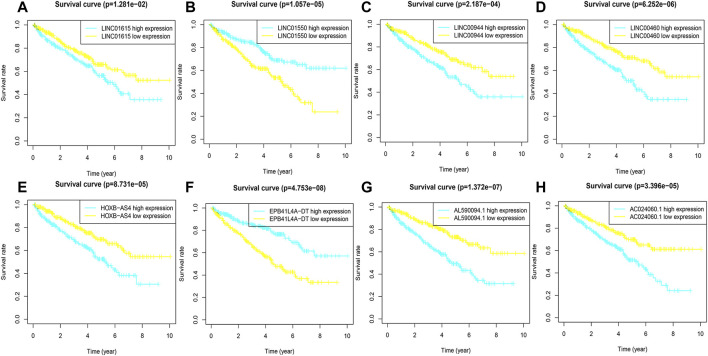
FIGURE 3.
K-M curves of eight FRlncRNAs in the prognostic signature. (A-H) The K-M survival curves of AC024060.1, AL590094.1, HOXB-AS4, LINC00460, LINC00944, and LINC01615 showed the high expression group had worse OS than the low expression group in the training cohorts (p < 0.05) and the K-M curves of EPB41L4A-DT and LINC01550 showed the high expression group had better OS than the low expression group in the training cohorts (p < 0.05).

