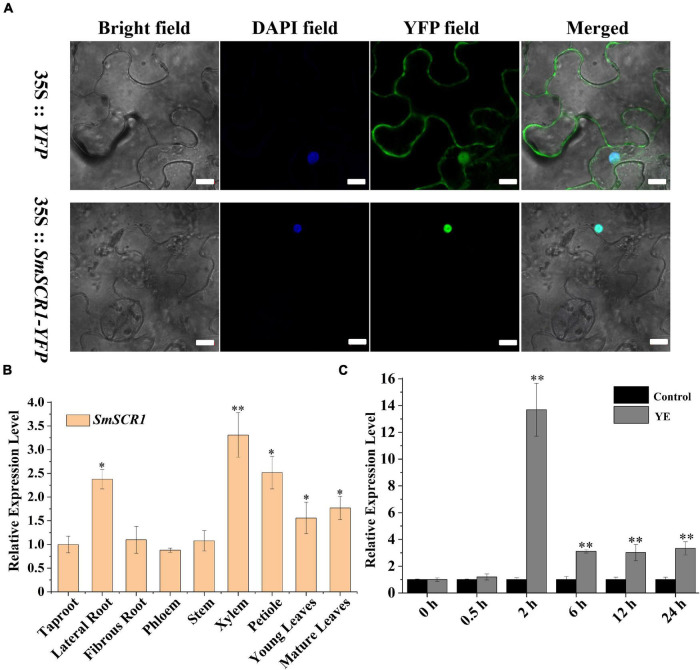
FIGURE 3.
Expression profile of SmSCR1. (A) Transient expression of the SmSCR1 in Nicotiana benthamiana leaf epidermal cells. Scale bars represent 10 μm. (B) The expression patterns of SmSCR1 in different tissues. Fold changes of the relative expression level of SmSCR1 gene in other tissues are all normalized to the taproot. (C) Induced effect of YE on the expression of SmSCR1. Fold changes of the gene relative expression levels are all normalized to the control without induction by YE at 0 h. Asterisks indicate significant differences between the taproot and other tissues in (B) and between treatment and control in (C) at one significant level of t-test (*p < 0.05; **p < 0.01). Data are means of three replicates with SDs.

