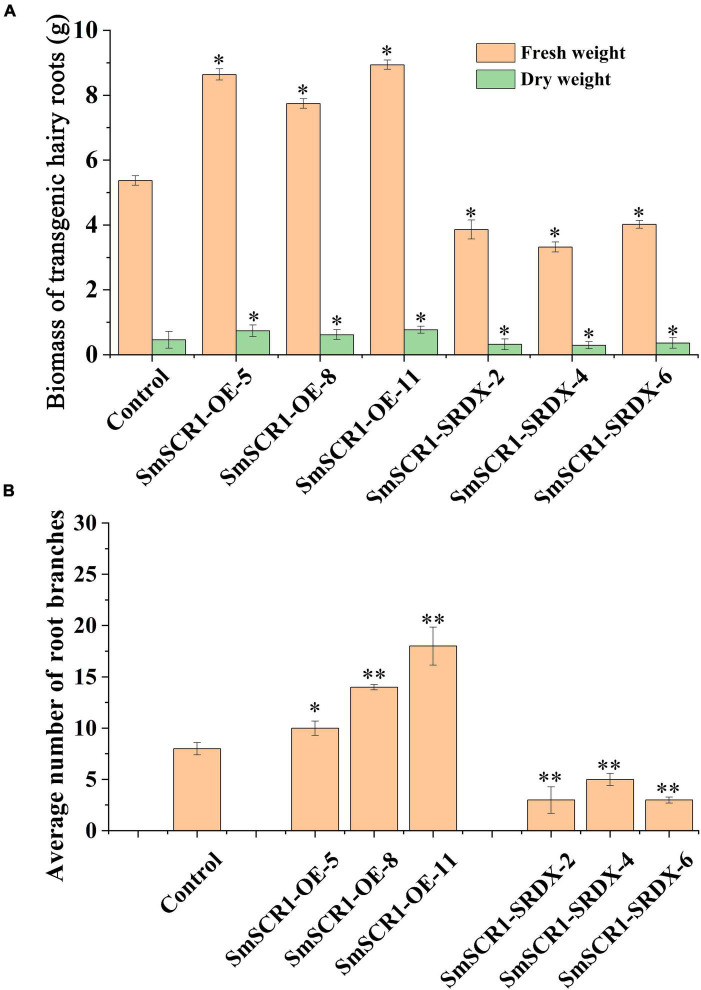
FIGURE 6.
Phenotype of the SmSCR1 transgenic hairy root. (A) Biomass of transgenic hairy root. (B) An average number of root branches. Asterisks indicate significant differences between the transgenic hairy root lines and control at one significant level of t-test (*p < 0.05; **p < 0.01). Data are means of three replicates with SDs.

