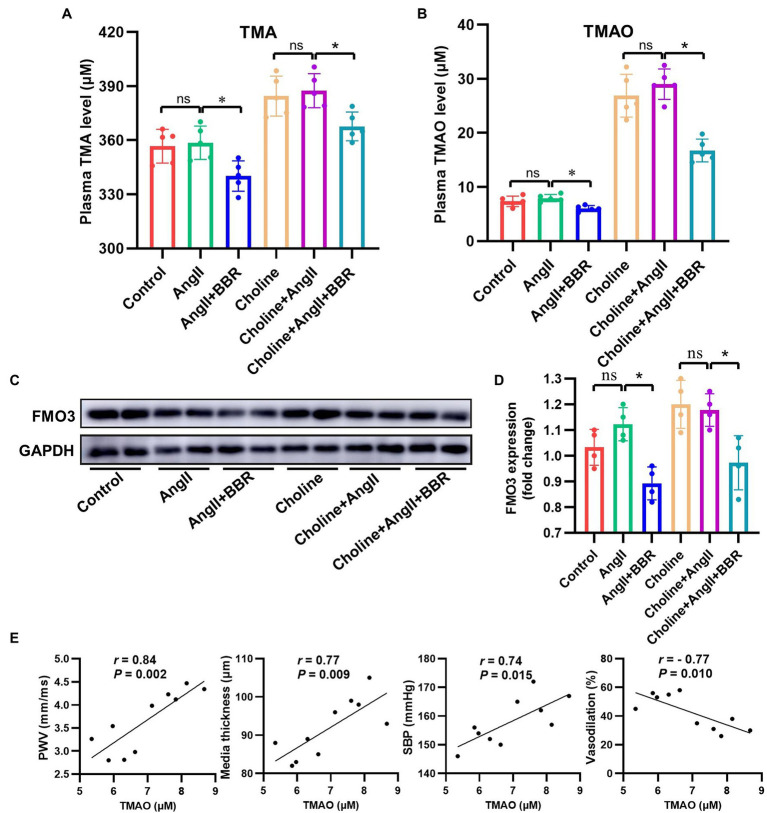
Figure 4.
BBR Inhibited TMAO Synthesis in Ang II-Induced Hypertensive Mice. (A) Plasma TMA level of each group (n = 5). (B) Plasma TMAO level of each group (n = 5). (C) Western blotting detection of FMO3 expression in the liver. (D) Statistical analysis of hepatic FMO3 expression of each group (n = 4). (E) Linear correlation between TMAO level and PWV, media thickness of aorta, SBP and endothelium dependent vasodilation (n = 10). *p < 0.05.

