Figure 5.
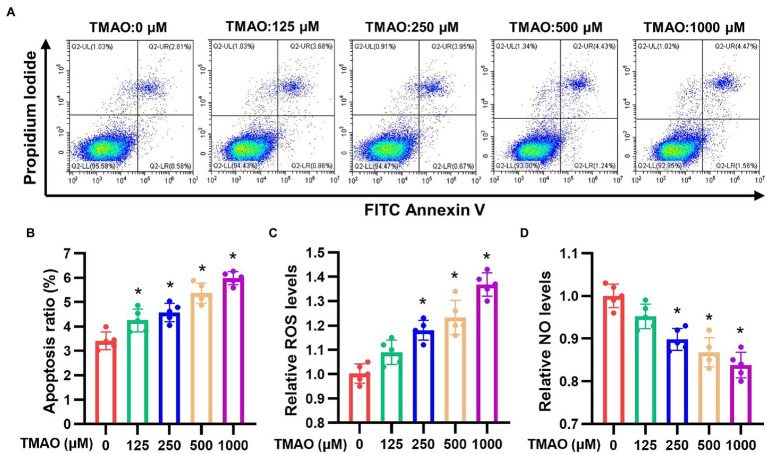
Apoptosis ratio, intracellular ROS and NO levels of HAECs induced by different concentrations of TMAO in vitro. (A) Representative images of apoptosis ratio. Quantitative analysis of apoptosis ratio (B), relative ROS levels (C) and relative NO levels (D). n = 5 for each group; *p < 0.05 vs. control group.

