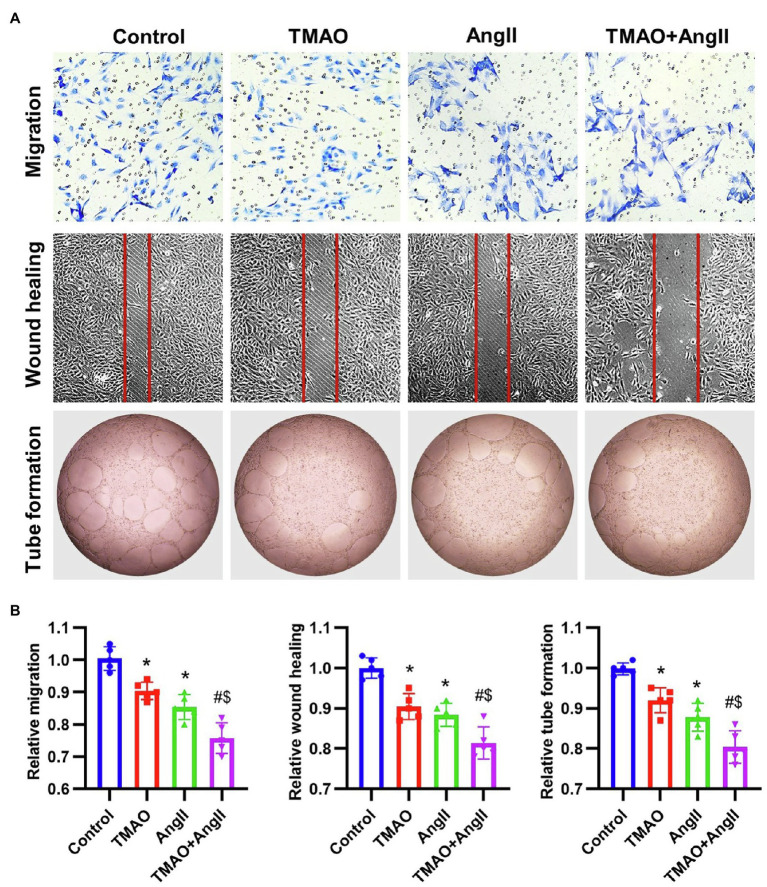
Figure 6.
The in vitro function of HAECs treated with TMAO (500 μmol/L) and Ang II (2 μmol/L). (A) Representative images of in vitro function of HAECs (including transwell migration, wound healing and tube formation). (B) Quantitative analysis of in vitro function of HAECs. n = 5 for each group; *p < 0.05 vs. control group, #p < 0.05 vs. TMAO group, $p < 0.05 vs. AngII group.

