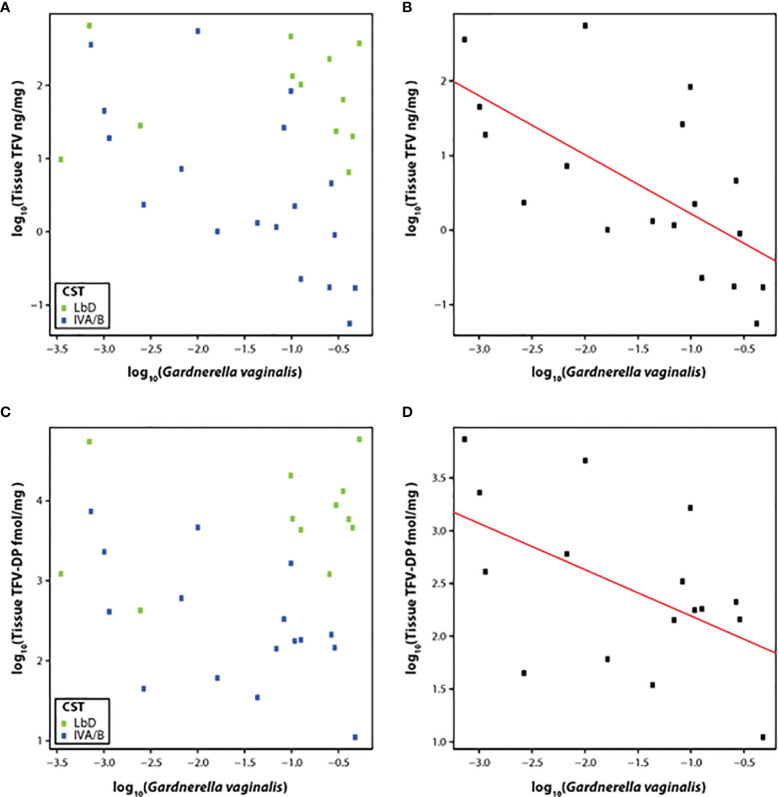
Figure 3.
(A–D) Correlation of TFV (A) and TFV-DP (C) tissue concentrations with relative abundance of G. vaginalis species and fit of the linear model with CST IV samples at the end of treatment with TFV tissue concentrations (B) and TFV-DP tissue concentrations (D). Green dots represent participants who had Lactobacillus-dominated (LbD) vaginal microbiota at the time of sampling and their individual TFV vaginal fluid concentration and relative abundance of Gardnerella vaginalis. Blue dots represent participants who had diverse anaerobe-dominated (CST IVA/B) vaginal microbiota at the time of sampling and their individual TFV vaginal fluid concentration and relative abundance of Gardnerella vaginalis. Black dots in the linear fit model represent participants who had diverse anaerobe-dominated (CST IVA/B) vaginal microbiota at the time of sampling and their individual TFV vaginal fluid concentration and relative abundance of Gardnerella vaginalis.

