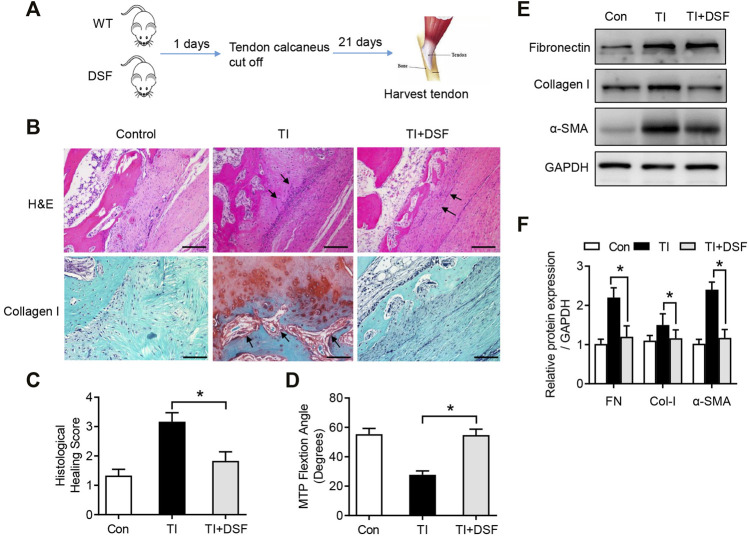
FIGURE 3.
DSF rescued peritendinous fibrosis in TI. (A) The diagram of mouse model conduction. (B) H&E and immunohistological staining of Col-I in the control, TI, and TI oral with DSF (50 mg/kg) mouse groups. Scale bar = 200 μm. (C) Histological adhesion score and histological healing score from the indicated groups (n = 6 per group). (D) MTP joint flexion ROM of the indicated groups (n = 6 per group). (E) Western blot analysis of FN, Col-I, and α-SMA in tendon (n = 6 per group). Data are presented as the mean ± SEM (n = 6) (C,D). *p < 0.05.

