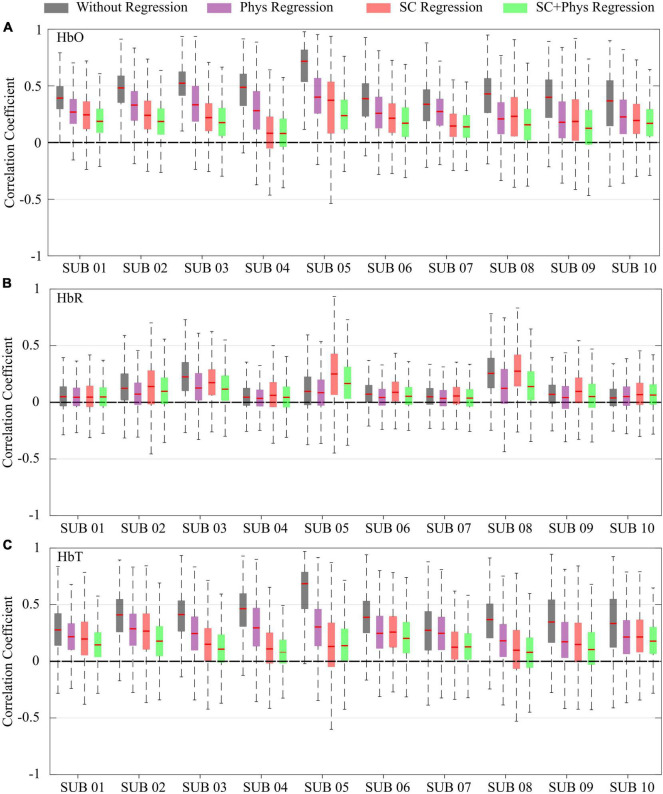
FIGURE 3.
Box plot for the correlation coefficients for each participant and preprocessing method for (A) oxy-hemoglobin (HbO), (B) deoxy-hemoglobin (HbR), and (C) total-hemoglobin (HbT) concentrations. The different colors correspond to different preprocessing approaches: no extracerebral regression (gray), after regression with additional physiological measurements (violet), after regression with short channels (red), and after regression with short channels combined with physiological measurements (green).

