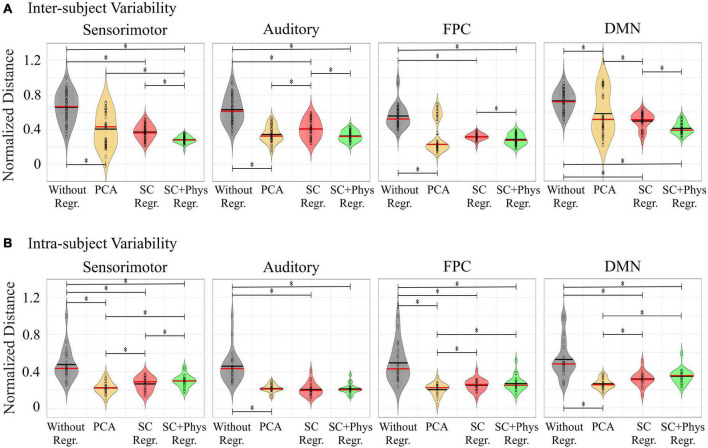
FIGURE 6.
Violin plots with (A) inter- and (B) intra-subject variability estimated through the Euclidian distance among networks from pairs of participants. The red and black lines inside each violin are the median and mean values, respectively. The black circles are actual values. To verify the impact of each preprocessing approach on the inter- and intra-subject variability, we normalized the distances by the maximum values across all preprocessing approaches within each network. (*) denotes pairs of variability distributions statistically different (p < 0.05) from each other assessed with a two-sided t-test.

