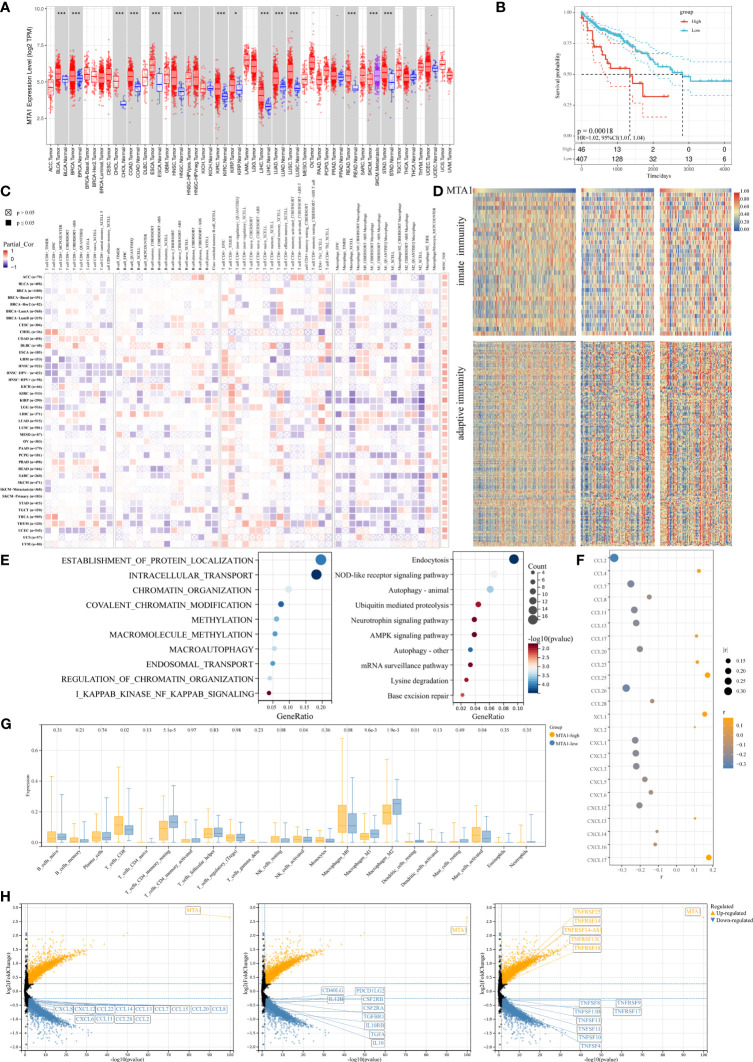
Figure 1.
MTA1-driven immunosuppressive tumor microenvironment in colorectal cancer. (A) Pan-cancer expressional characterization of MTA1 in tumor and normal tissues from the TCGA database. (B) Kaplan–Meier curves of overall survival of patients with MTA1-high and MTA1-low tumors. The MTA1-high group included patients whose tumors expressed MTA1 mRNA at the level of the upper 25%. The MTA1-low group included patients whose tumors expressed MTA1 mRNA at the level of the lower bottom 25%. COAD and colon adenocarcinoma were defined in the TCGA dataset. P-values correspond to two-sided log-rank analyses. (C) Immune infiltration based on bulk RNA-seq transcriptome data from the TCGA database assessed by different algorithms. (D) Heatmap representing the correlation between MTA1 expression level and enrichment score defined by GSVA of signaling cascades from MSigDB related to immunomodulation in the TCGA colon adenocarcinoma cohort. (E) Gene set enrichment of the top 500 MTA1 coexpression genes (p-adjust <0.05; cluster Profiler). (F) Pearson correlation between the expression of MTA1 and chemokines in colon cancer cell lines in the CCLE database (p-value <0.05). (G) Enrichments of the indicated immune cell populations calculated via the Cibersortx algorithm in MTA1-high versus MTA1-low populations (low: n = 92; high: n = 87; unpaired two-tailed t test). (H) Differentially expressed gene (DEG) in MTA1-high versus MTA1-low populations (low: n = 128; high: n = 128; limma). The meaning of symbols was provided in Statistical Analysis.

