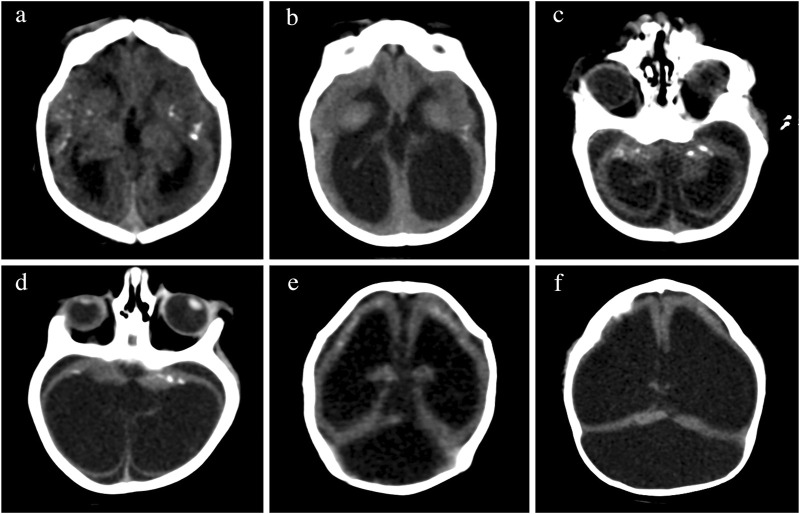
FIGURE 4.
Changes in brain imaging observed during the first year of life. CT of the brain of the same patient in the first month of life in the upper row in (A,C,E), at 6 months of age in lower rows (B,D), and at 13 months of age in (F). Calcifications are more difficult to visualize at 6 months of age (B,D) than at birth (A,B). We observed increases in volume of intraventricular and extra-axial fluids (bottom pictures) in comparison to the initial exam (top pictures). The increasing ventricular dilatation did not show clinical or imaging signs of increased intracranial pressure at 6 months (B,D), but a high tentorium confirmed progressive hydrocephalus requiring surgical shunting at 13 months (F).

