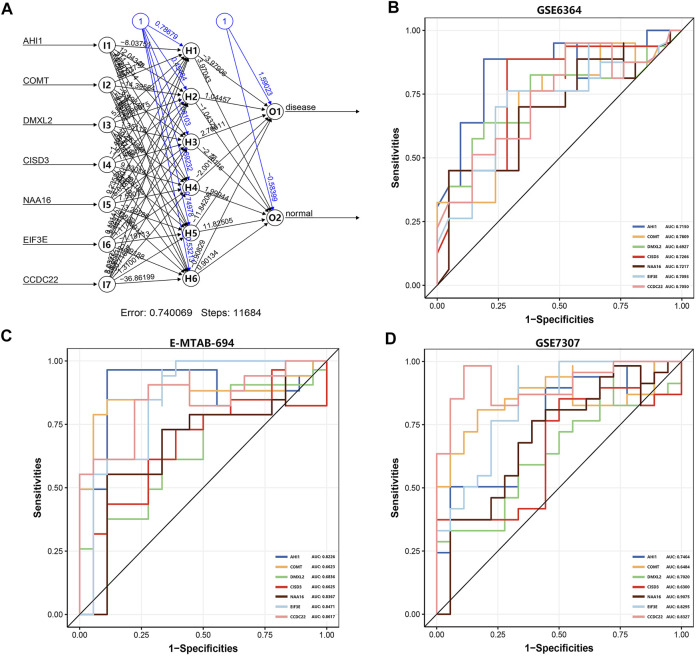
FIGURE 5.
The artificial neural network model and the evaluation of the ROC curve. (A) The visualization of the artificial neural network model. (B) The evaluation results of the ROC curve in the GSE6364 dataset. (C) The verification results of the ROC curve in the E-MTAB-694 dataset. (D) The verification results of the ROC curve in the GSE7307 dataset. The x-axis and y-axis represent specificity and sensitivity, respectively. The AUC value is the area under the ROC curve.

