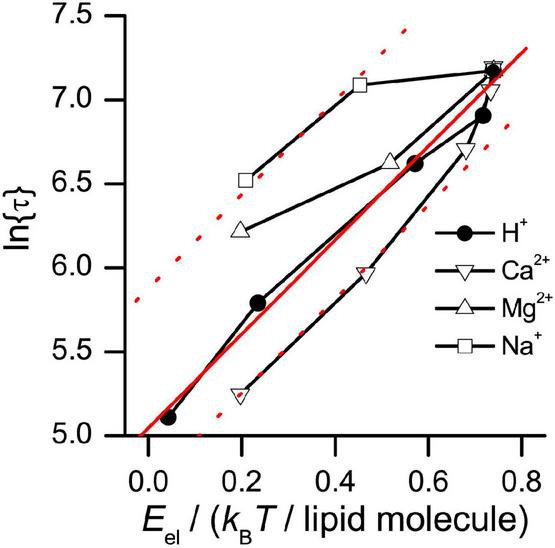
FIGURE 11.

Relation between ln{τ} and the electrostatic free energy (Eel) of DOPS bilayers. Eel was calculated as described in Supplementary Material, using results obtained by either varying the pH (results from Figure 6), or by varying the concentration of Ca2+, Na+, or Mg2+ in aqueous solution, at pH 7 (results from Lundbæk et al., 1997). Solid red line: Linear fit to results obtained using H+. Dotted red lines: Linear fit to results obtained using H+, shifted vertically to best match results obtained with Ca2+ or Na+.
