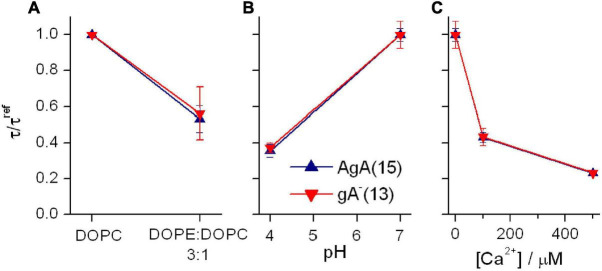
FIGURE 8.
Effects of changes in bilayer composition and head group interactions on AgA(15) and gA–(13) channel lifetimes; results for AgA(15) in blue, results for gA–(13) in red. (A) Effects of varying the DOPE:DOPC molar ratio. The superscript “ref” denotes the value in DOPC bilayers. Experimental conditions as in Figure 7. (B) Effects of pH on the channel lifetimes in DOPS bilayers. The superscript “ref” denotes the value at pH 7. 0.1 M NaCl. (C) Effects of [Ca2+] on the channel lifetimes in DOPS bilayers. The superscript “ref” denotes the value in the nominal absence of Ca2+. 0.1 M NaCl, pH 7. In all panels: mean ± SD, n ≥ 3.

