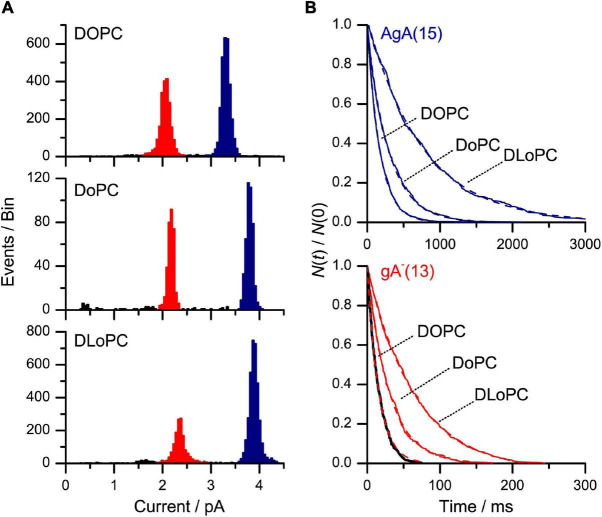
FIGURE 9.
Effects of changes in bilayer composition on AgA(15) and gA–(13) channel function. (A) Current transition amplitude histograms obtained in (from top to bottom): DOPC/n-decane, DoPC/n-decane and DLoPC/n-decane bilayers. The lower amplitude peaks, highlighted in red, denote gA–(13) channels; the higher amplitude peaks, highlighted in blue, the AgA(15) channels. (B) The corresponding normalized single-channel duration histograms. Results from single experiments fitted by single exponential distributions (the colors have same significance as in A). The lifetime results are summarized in Table 3. 1 M NaCl, pH 7, 200 mV, 500 Hz.

