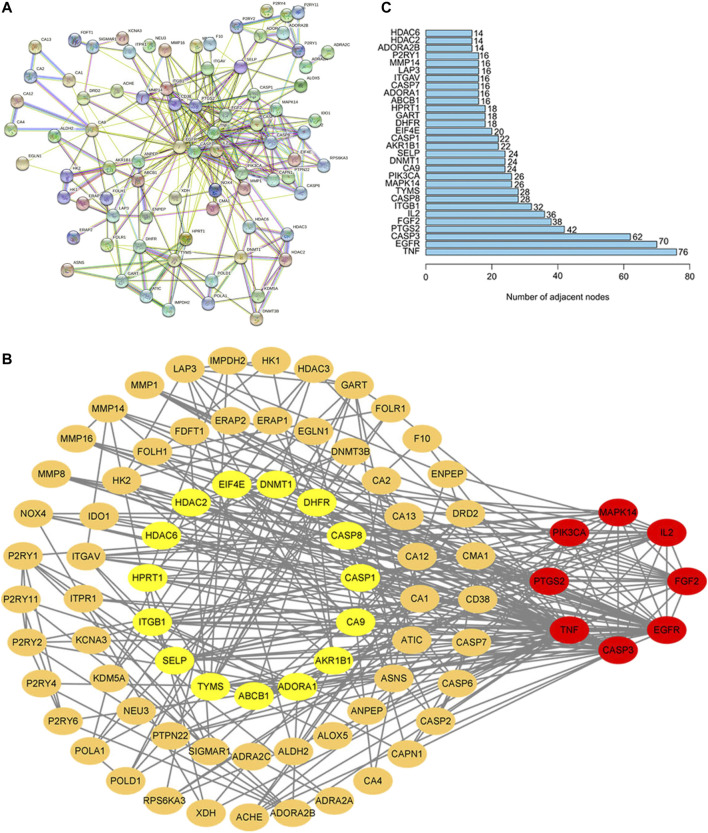
FIGURE 3.
PPI Network Analysis in the Common Target of Baicalin and CS. (A) In STRING, the nodes stand for proteins and the junctions represent the interactions between proteins. The more junctions there are, the greater the degree of connection is. (B) The core genes screened by Cytoscape 9.0. The node color was regulated by the degree centrality, and the red node had a higher centrality; (C) In the core gene bar diagram, the horizontal coordinates indicate the number of genes and the vertical coordinates indicate the gene names.

