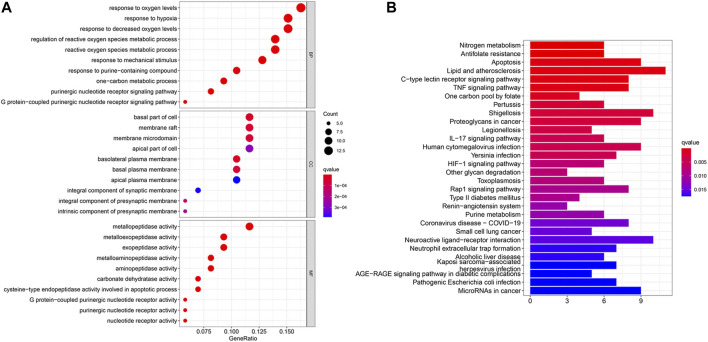
FIGURE 7.
GO and KEGG enrichment analysis. (A) In the GO analysis bubble diagram, the vertical coordinates indicate the names of biological process (BP), cellular component (CC) and molecular function (MF), respectively, and the horizontal coordinates indicate the degree of enrichment. (B) In the KEGG functional enrichment graph, the vertical coordinate represents the pathway name and the horizontal coordinate represents the number of genes enriched by the pathway.

