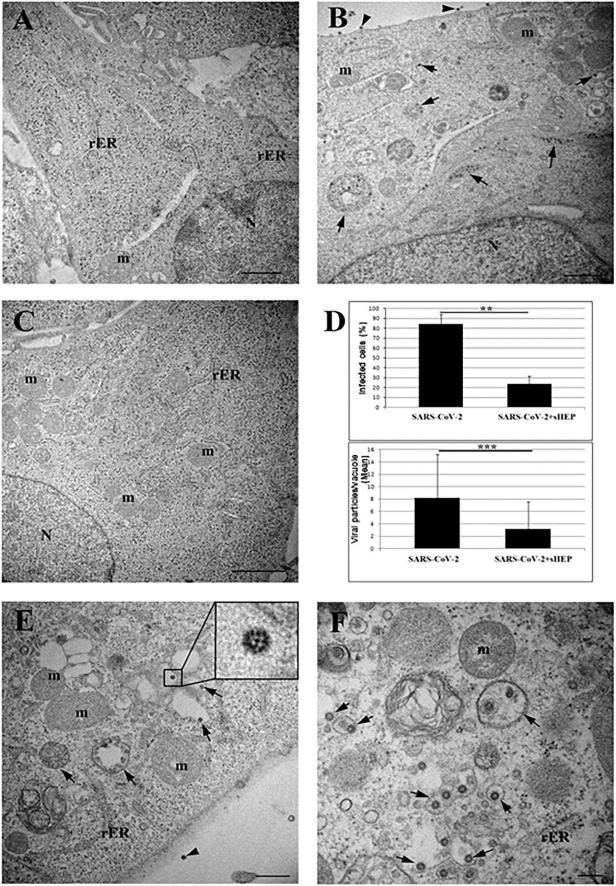
FIGURE 2.
Electron microscopy ultrastructure features of SARS-CoV-2-hfected VERO E6 cells treated with sHEP. Panel (A) the image shows the typical morphology of VERO E6 cells after 24 h culturing in presence of sHEP 25 μg/mL. No signs of ultrastructural alterations were evident. Panel (B) SARS-CoV-2 infected VERO E6 cell: arrows point to membrane bound vacuoles containing numerous viral particles. Mature viral particles are visible at the cell surface (arrowheads). Panel (C) among infected VERO E6 cultured in presence of sHEP 25 μg/mL, numerous uninfected cells were observed showing normal intracellular morphology and no sign of viral presence, as here shown. Panel (D) percentage of infected cells (top graph) and mean number of viral particles counted within vesicles (bottom graph) measured in infected cultures were compared to those observed among cultures infected and treated with 25 μg/mL sHEP (SARS-CoV-2 + sHEP). The differences were significant. Data reported as means values ± SD (**p < 0.01; ***p < 0.001; no asterisk, p ≥ 0.05). Panel (E) sHEP 25 μg/mL treated SARS-CoV-2 infected cell. Arrows point to membrane bound vacuoles containing typical viral particles. Mature viral particle is visible at the cell surface (arrowhead). Higher magnification of viral particle is visible in the boxed area: black dots are visible inside the viral particles due to cross section through the nucleocapside. Panel (F) higher magnification of an infected cell showing numerous single virions, or small group of virions, enclosed in single membrane vacuoles (arrows). N, nucleus; m, mitochondrion; rER, rough endoplasmic reticulum. Scale bars: A,B = l μm; C = 2 μm; E = 500 nm; F = 200 nm.

