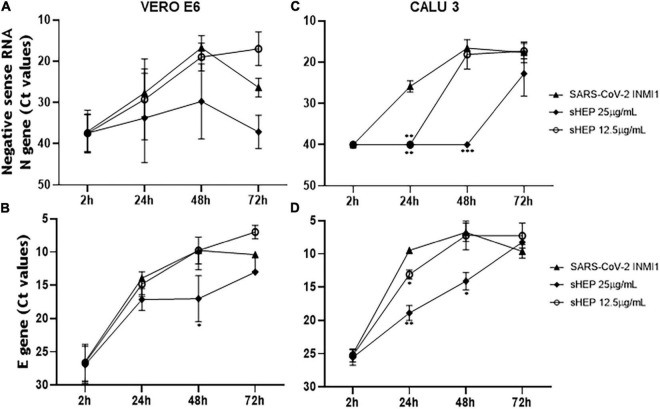
FIGURE 3.
Kinetics of intracellular SARS-CoV-2 N and E genes expression in VERO E6 and CALU3. After viral infection, sHEP was added at 12.5 or 25 μg/mL and SARS-CoV-2 N and E genes RNA transcripts expression was evaluated at indicated time points by real-time RT-PCR. Panels (A,C) Ct values refer to negative sense RNA transcripts for N gene detected in VERO E6 and CALU3 cell extracts, respectively. Panel (A) in VERO E6, no significant differences were observed. Panel (C) in CALU3, the negative sense RNA transcript levels of the N gene were significantly lower at 24 h p.i. (p = 0.0024) and at 48 h p.i. (p = 0.0002) with 25 μg/mL sHEP, with respect to untreated but infected cells. Panels (B,D) Ct values of E gene RNA detected in VERO E6 and CALU3 cell extracts, respectively. Panel (B) in VERO E6, E gene was significantly lower at 48 h p.i. (p = 0.05) Panel (D) accordingly, E gene RNA transcripts in CALU3 were also significantly lower at 24 h and 48 h p.i. (p = 0.066, and p = 0.0302, respectively). Data points represent the mean (±SD) of three independent experiments, each performed in quadruplicate. The asterisks indicate statistically significant differences determined by Student’s t-test (***p < 0.001, **p < 0.01; *p < 0.05; no asterisk, p ≥ 0.05) between infected cells and those infected and cultured in presence of sHEP.

