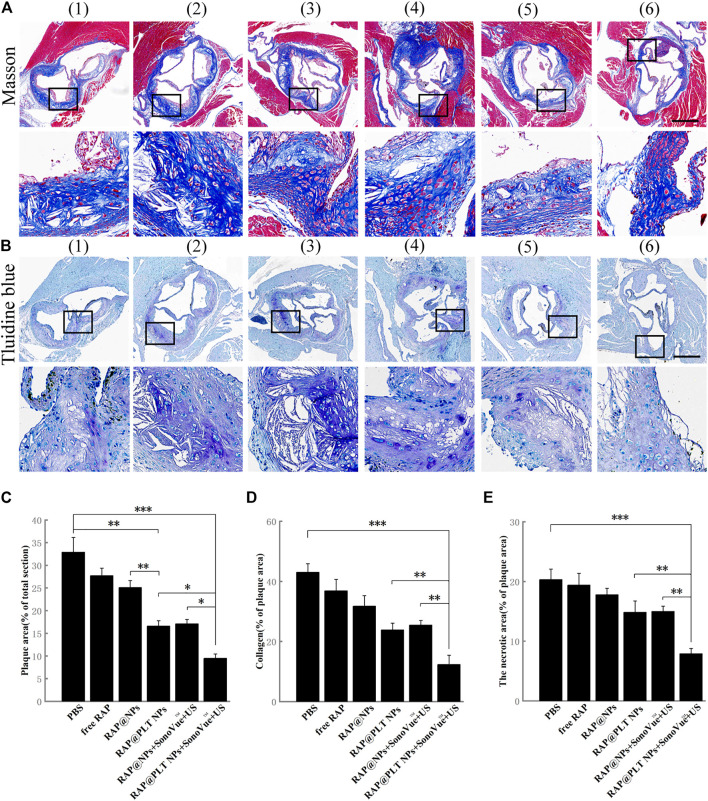
FIGURE 7.
Immunohistochemistry analyses of aortic root sections from ApoE−/− mice after different treatments. (A) The images of collagen in the plaque areas stained by Masson’s trichrome (scale bar = 500 µm). (B) The images of the necrotic areas stained by Toluidine blue (scale bar = 500 µm) (Wang et al., 2021).- (Costagliola di Polidoro et al., 2021) referred to (Wang et al., 2021) PBS (Libby, 2012); free RAP (Shapiro and Fazio, 2016); RAP@NPs (Moriya, 2019); RAP@PLT NPs (Winkel et al., 2014); RAP@NPs + SonoVue™ + US (Costagliola di Polidoro et al., 2021); RAP@PLT NPs + SonoVue™ + US. (C) Quantitative data of the atherosclerotic plaque area in the aortic root sections. (D) Quantitative data of the content of collagen in aortic root sections. (E) Quantitative data of the necrotic areas in the aortic root sections. n = 5, mean ± SD, *p < 0.05, **p < 0.01, and ***p < 0.001.

