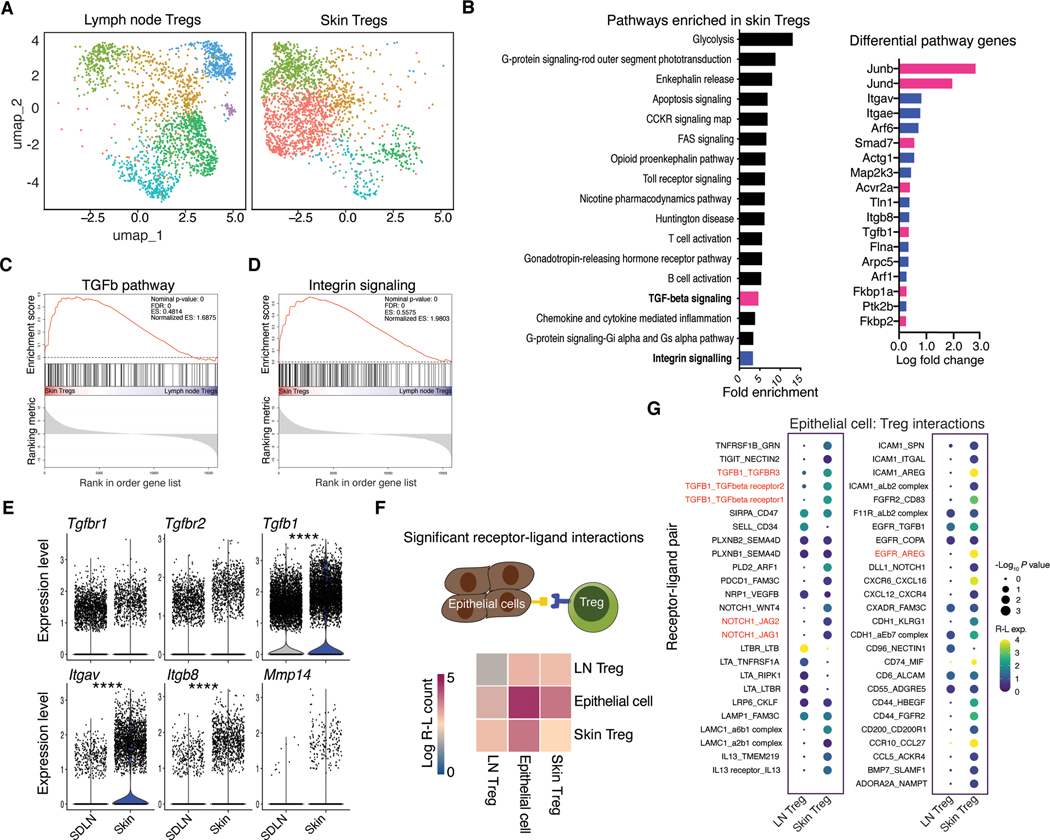
Fig. 1. Regulatory T cells in skin were transcriptionally attuned for their local tissue environment.
(A) UMAP of unsupervised clustering of single cell RNA-sequencing data comparing skin and lymph node Foxp3+ T cells isolated from Foxp3-GFP mice. Each tissue represents cells pooled from 3–4 mice (B) Significantly enriched (FDR <0.05, Fisher exact test) PANTHER Gene Ontology pathways identified from genes differentially expressed (non-parametric Wilcoxon rank sum test) between lymph node and skin Tregs in single cell sequencing data. (C, D) Gene set enrichment analysis (GSEA) showing enrichment of genes for skin versus lymph node Tregs probing TGF-β (C) or integrin (D) gene sets. (E) Differential gene expression analysis for select TGF-β pathway genes. (F), CellPhoneDB receptor-ligand interaction repository analysis identifying significant (P < 0.05) interactions between lymph node or skin Tregs from single cell RNA-seq data (A) and epithelial cells, reference (21). Heatmap indicates number of significant interactions between two cell populations. (G) Overview of statistically significant interactions between epithelial cells and Tregs using the CellPhoneDB pipeline. Dot size indicates interaction p values and color indicates expression means of the receptor-ligands pairs between 2 cell populations. Single cell RNA-seq data are derived from a single experiment where either skin or lymph node Tregs were pooled from 3–4 mice. For differential gene expression Seurat was used to perform a non-parametric Wilcoxon rank sum test. ****P < 0.0001.

