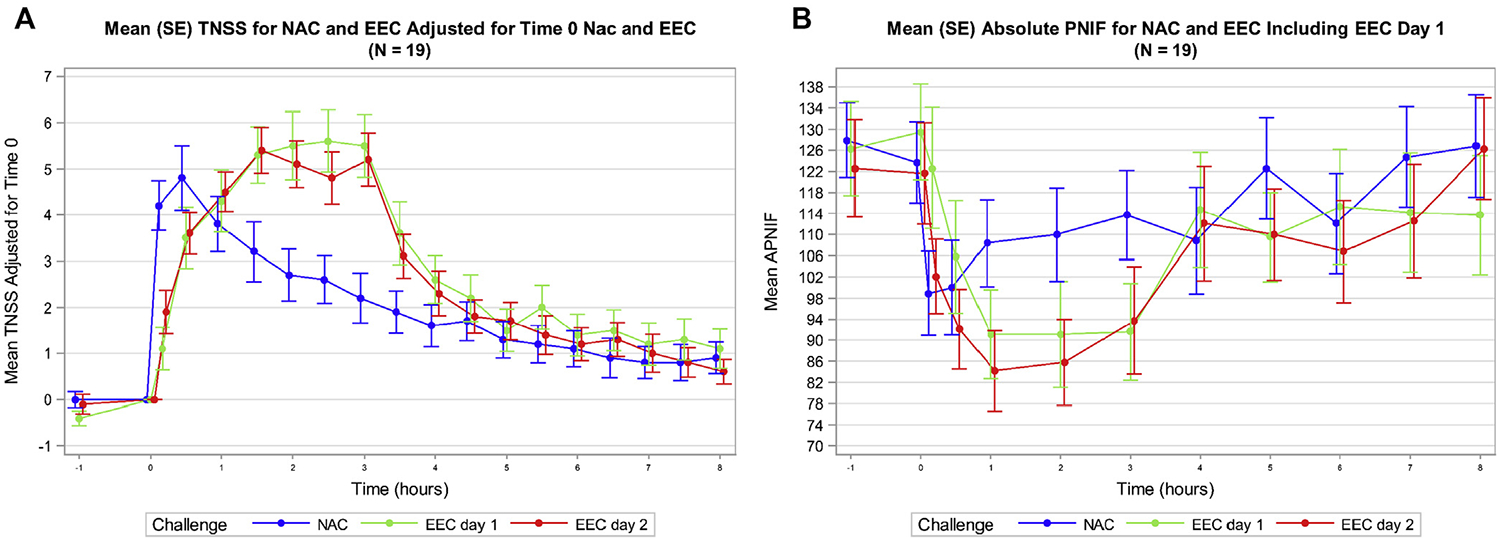
FIG 3.

Clinical responses to NAC and EEC. A, Mean (SE) TNSSs shown over time for NAC, day 1 of EEC, and day 2 of EEC for all participants. TNSSs with NAC peaked earlier than EEC but have an overall reduced magnitude of response. B, Mean (SE) PNIF shown over time for NAC, day 1 of EEC, and day 2 of EEC for all participants. Similar to TNSSs, PNIF peaked earlier during NAC but EEC induced a greater magnitude of nasal air flow obstruction. APNIF, Absolute PNIF.
