
FIG 6.
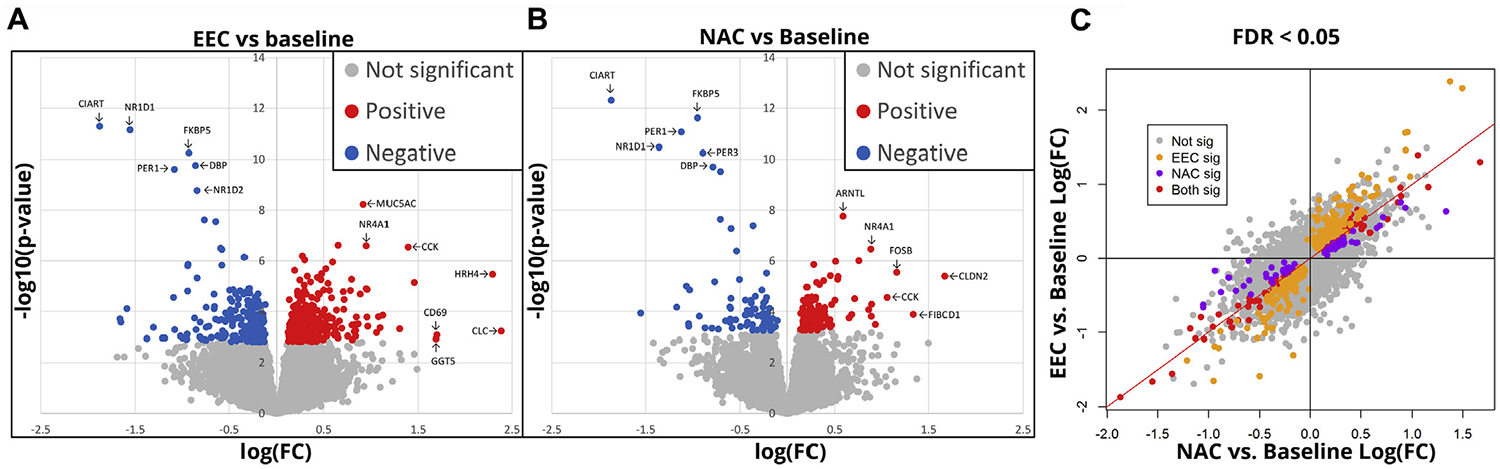
Similarities in gene expression after NAC and EEC. Volcano plots of nasal RNA-sequencing data showing genes with significant increases (red) or decreases (blue) in expression after (A) EEC or (B) NAC. C, Correlation in gene expression changes between NAC and EEC (FDR < 0.05). FC, Fold change; FDR, false discovery rate.