
Figure 3.
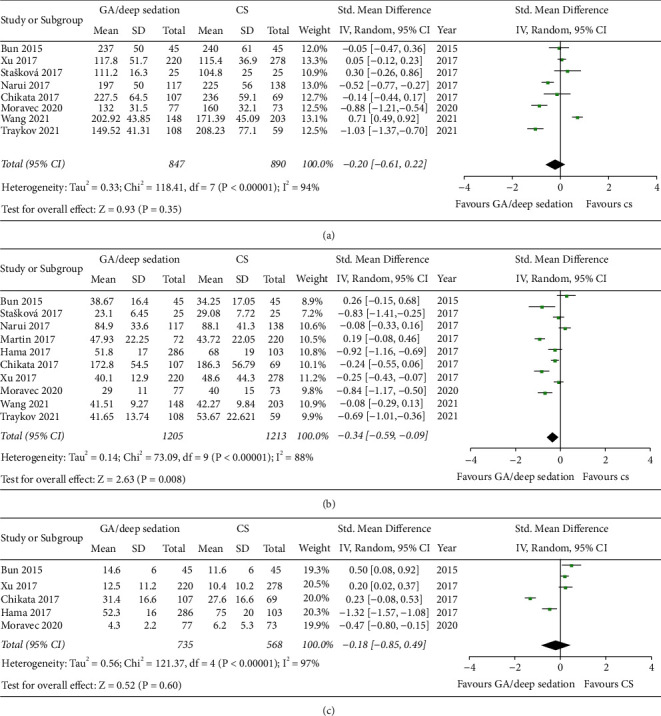
Forest plots comparing (a) mean procedural time of AF ablation, (b) mean ablation time, and (c) mean fluoroscopy time between the GA/deep sedation group and the CS group.
Official websites use .gov
A
.gov website belongs to an official
government organization in the United States.
Secure .gov websites use HTTPS
A lock (
) or https:// means you've safely
connected to the .gov website. Share sensitive
information only on official, secure websites.
Forest plots comparing (a) mean procedural time of AF ablation, (b) mean ablation time, and (c) mean fluoroscopy time between the GA/deep sedation group and the CS group.