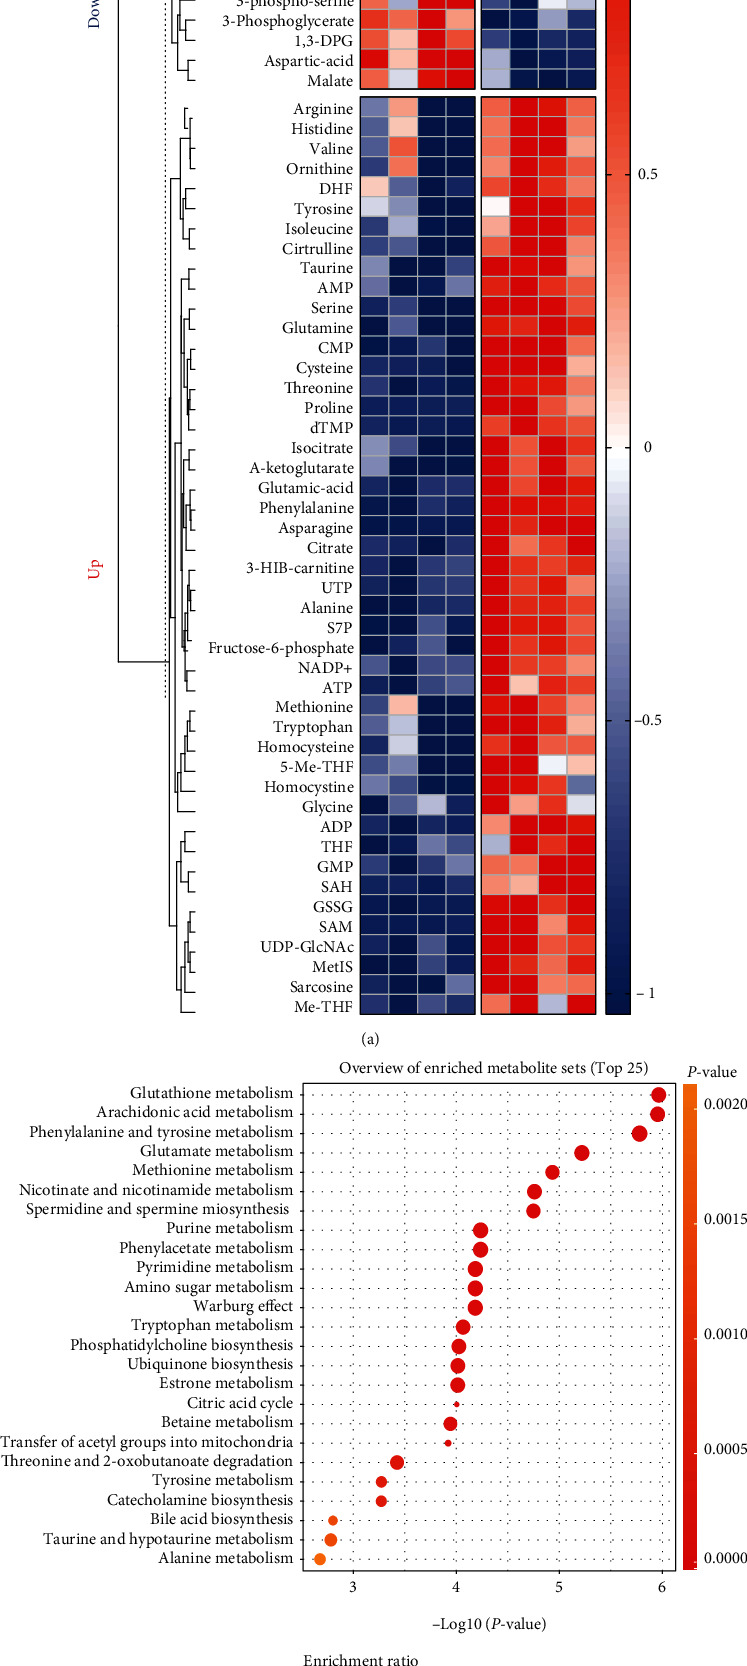
Figure 3.

Metabolomic analysis of cisplatin-treated HEI-OC1 cells. (a) Heatmap of metabolites collected from HEI-OC1 cells with cisplatin (20 μM for 12 h) exposure. (b) Overview of enriched metabolite pathways (top 25). (Analyses of data were all conducted on http://www.metaboanalyst.ca. NC: control group treated with same dose of DMF in cisplatin group.).
