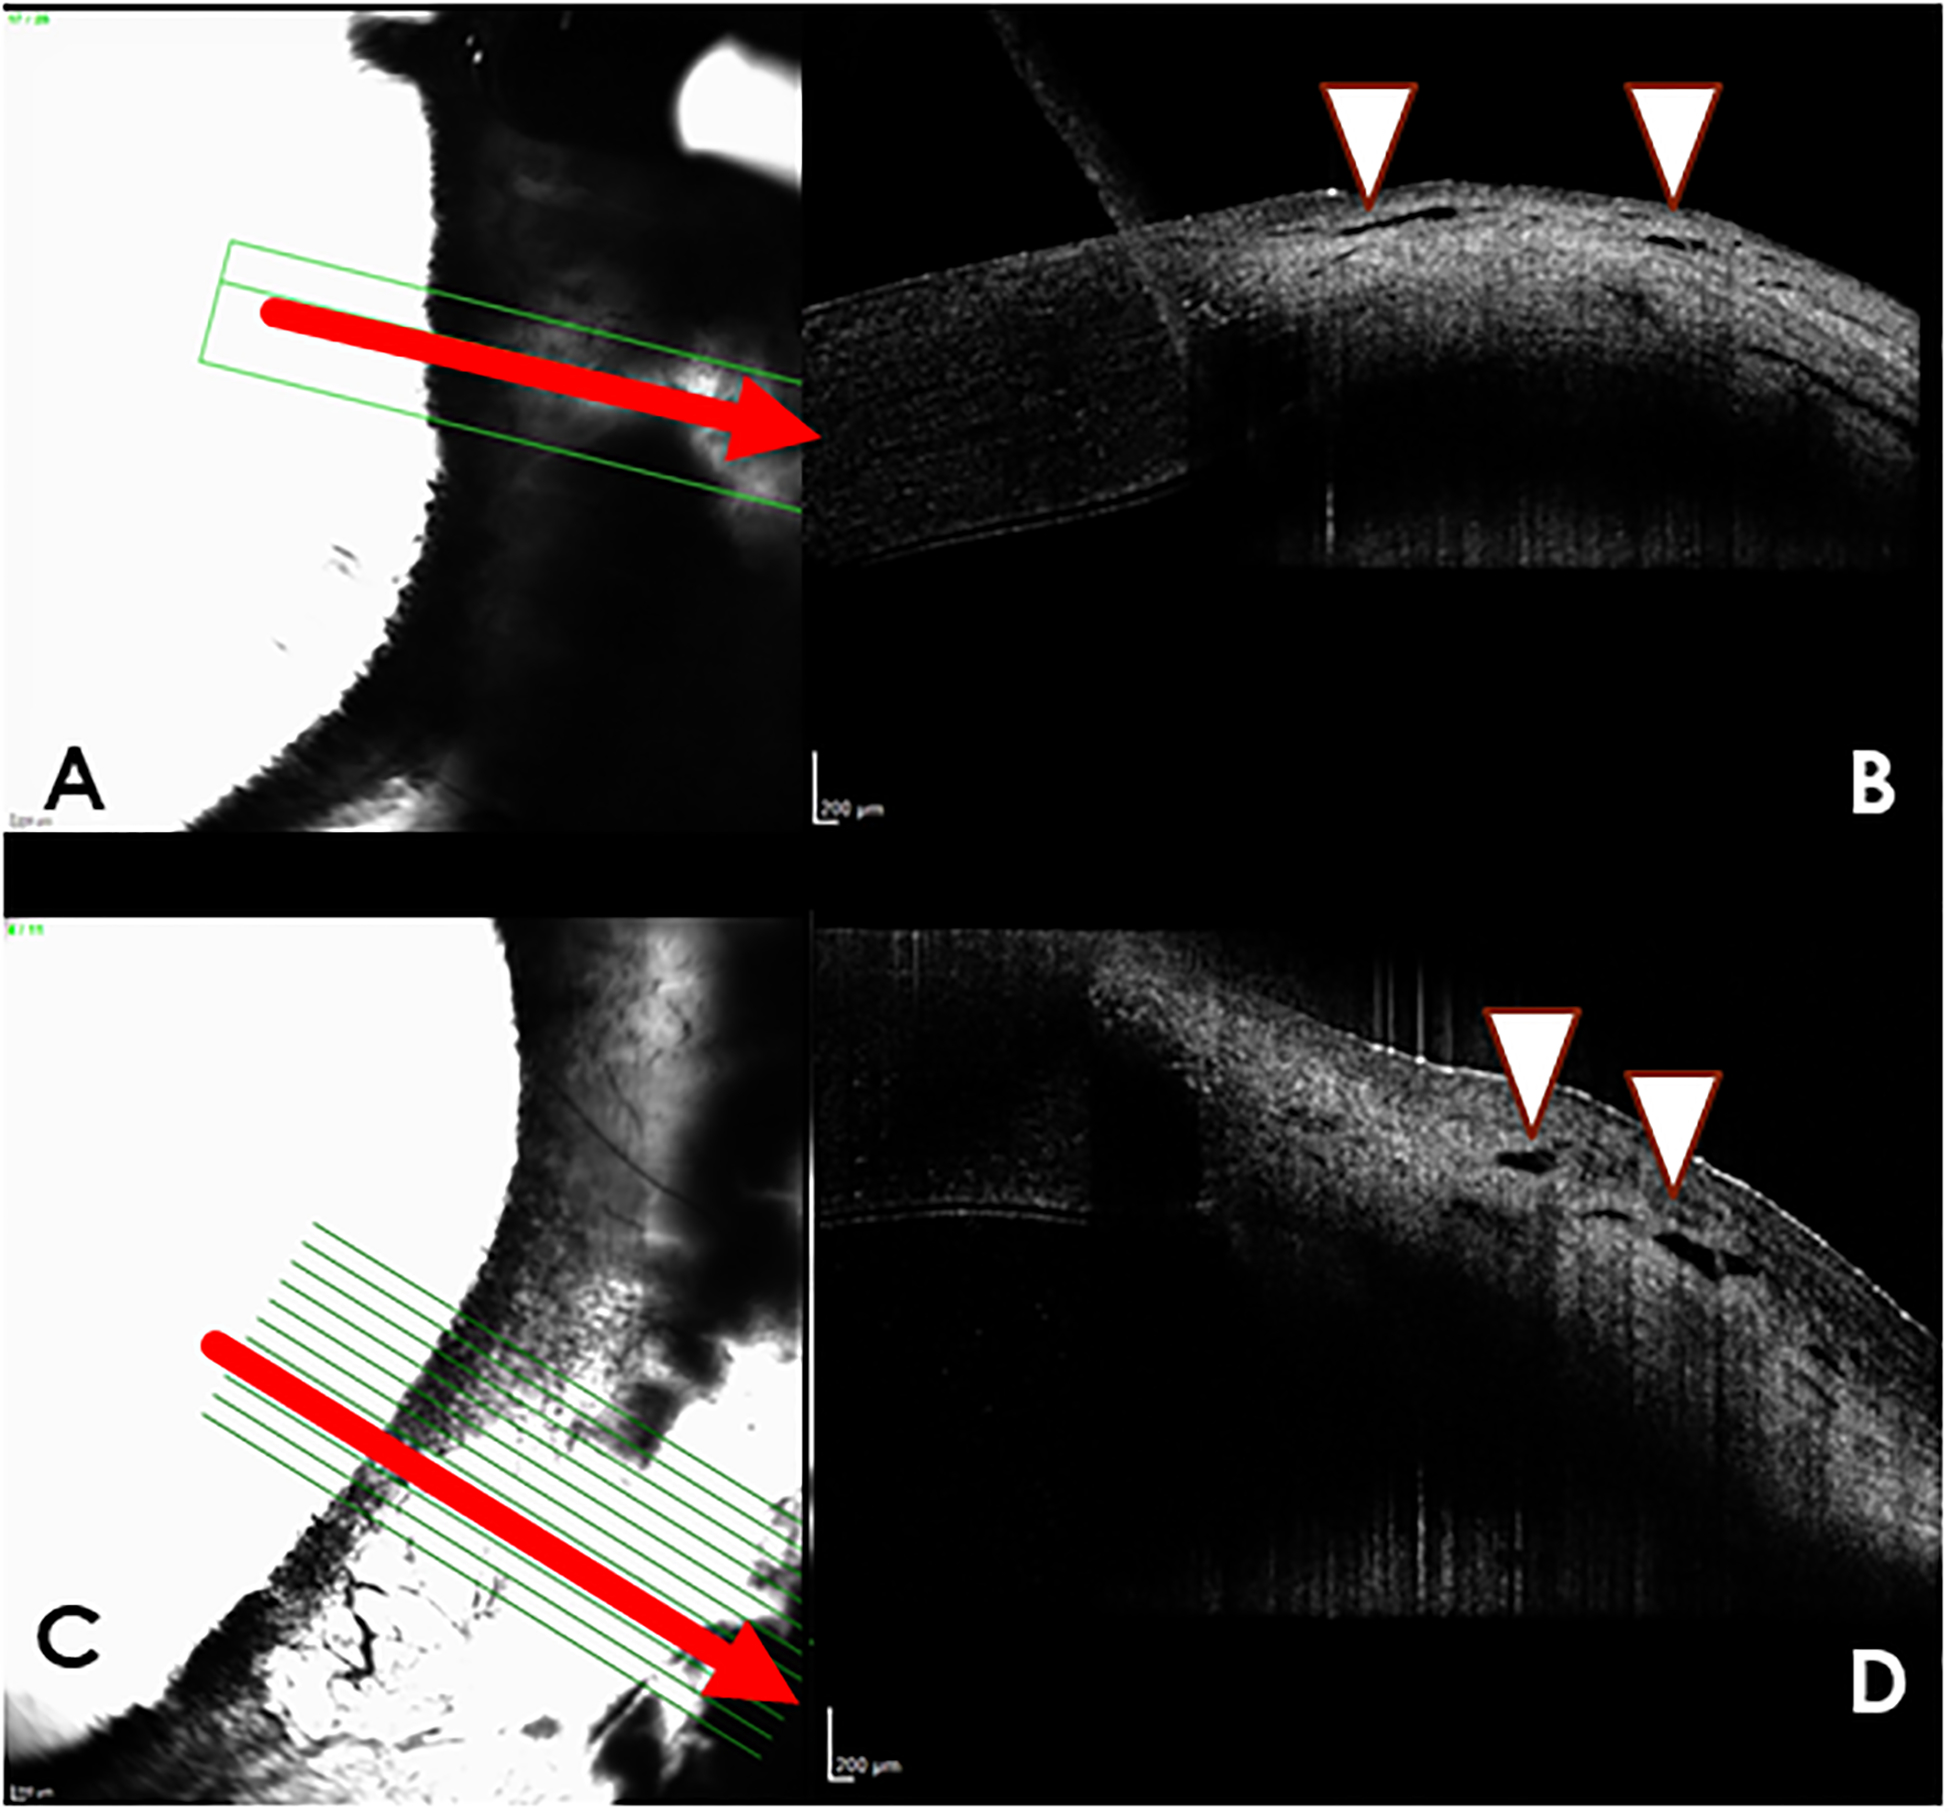
Figure 6.

Aqueous angiography (AA) with indocyanine green (A,C) and Spectral-domain optical coherence tomography (SD-OCT) images (B,D) from dogs with glaucoma. (A) Nasal quadrant of right eye of glaucomatous dog G4, “no flow” area with indocyanine green (ICG). There is minimal AA signal in this region. The corresponding OCT image (B) demonstrates very small, nearly collapsed scleral lumens (white arrow heads). (C) Temporal quadrant of left eye of glaucomatous dog G2, illustrates a “no flow” area with only diffuse fluorescence but no apparent intraluminal AA signal. (D) the corresponding OCT image demonstrates very small, nearly collapsed scleral lumens (white arrows) when compared to the normal dog.
