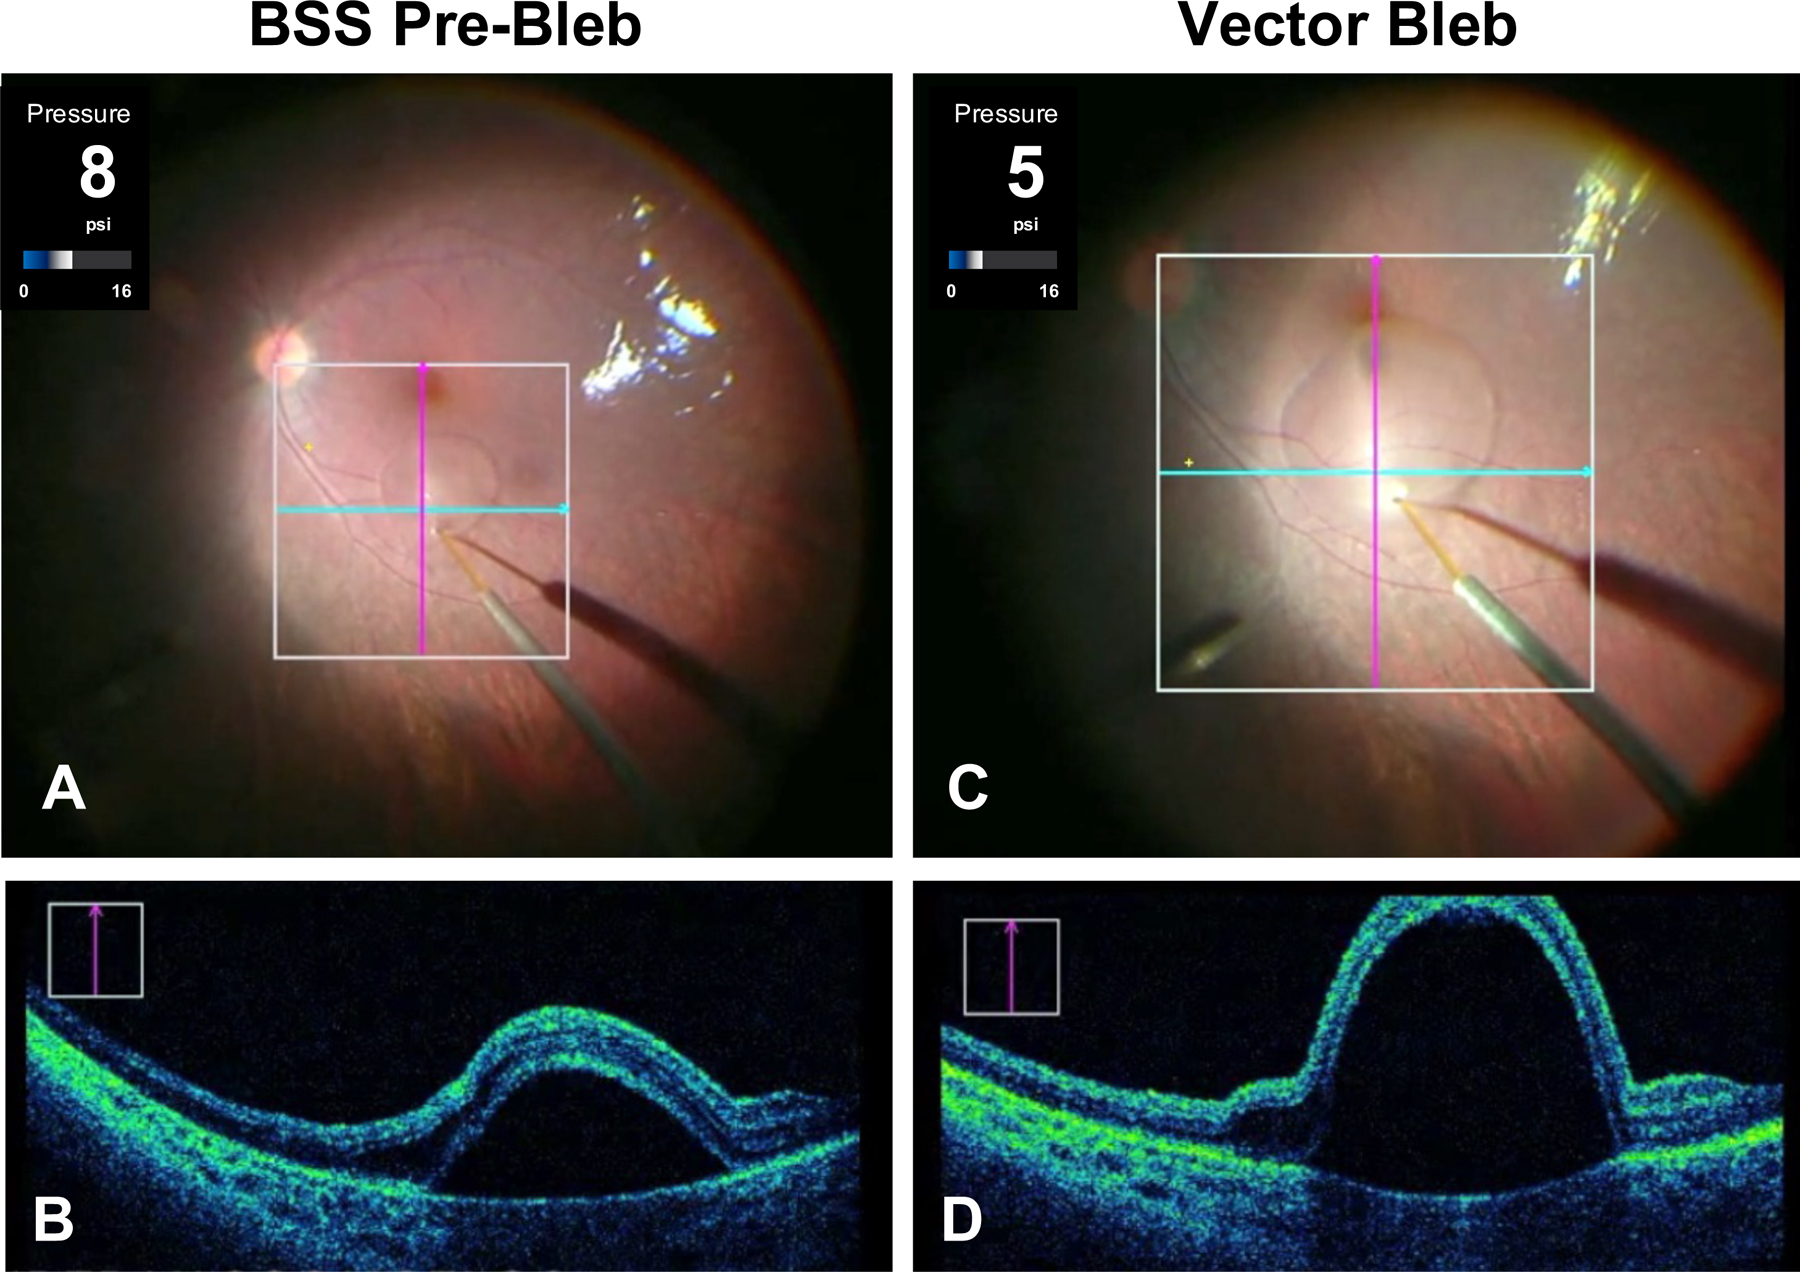
Figure 1.

Subretinal bleb formation using intraoperative optical coherence tomography (OCT) and foot-pedal controlled delivery. (A) Intraoperative fundus photograph during initiation of a subretinal pre-bleb using a 41-gauge injection cannula and balanced salt solution (BSS). (B) A vertical scan from live OCT as seen intraoperatively by the surgeon. This cross-section is at the level of the purple vertical line in A. These OCT images demonstrate successful focal retinal detachment using BSS. (C) Intraoperative fundus photograph during vector propagation of a subretinal bleb approaching the fovea. (D) A vertical scan from live OCT is shown at the level of the purple vertical line in C. The intraoperative injection pressures in pounds per square inch (psi) were continuously monitored during bleb formation. Note that the pre-bleb injection pressure (8 psi) was higher than the pressure needed to propagate the vector (5 psi) at the time these images were captured.
