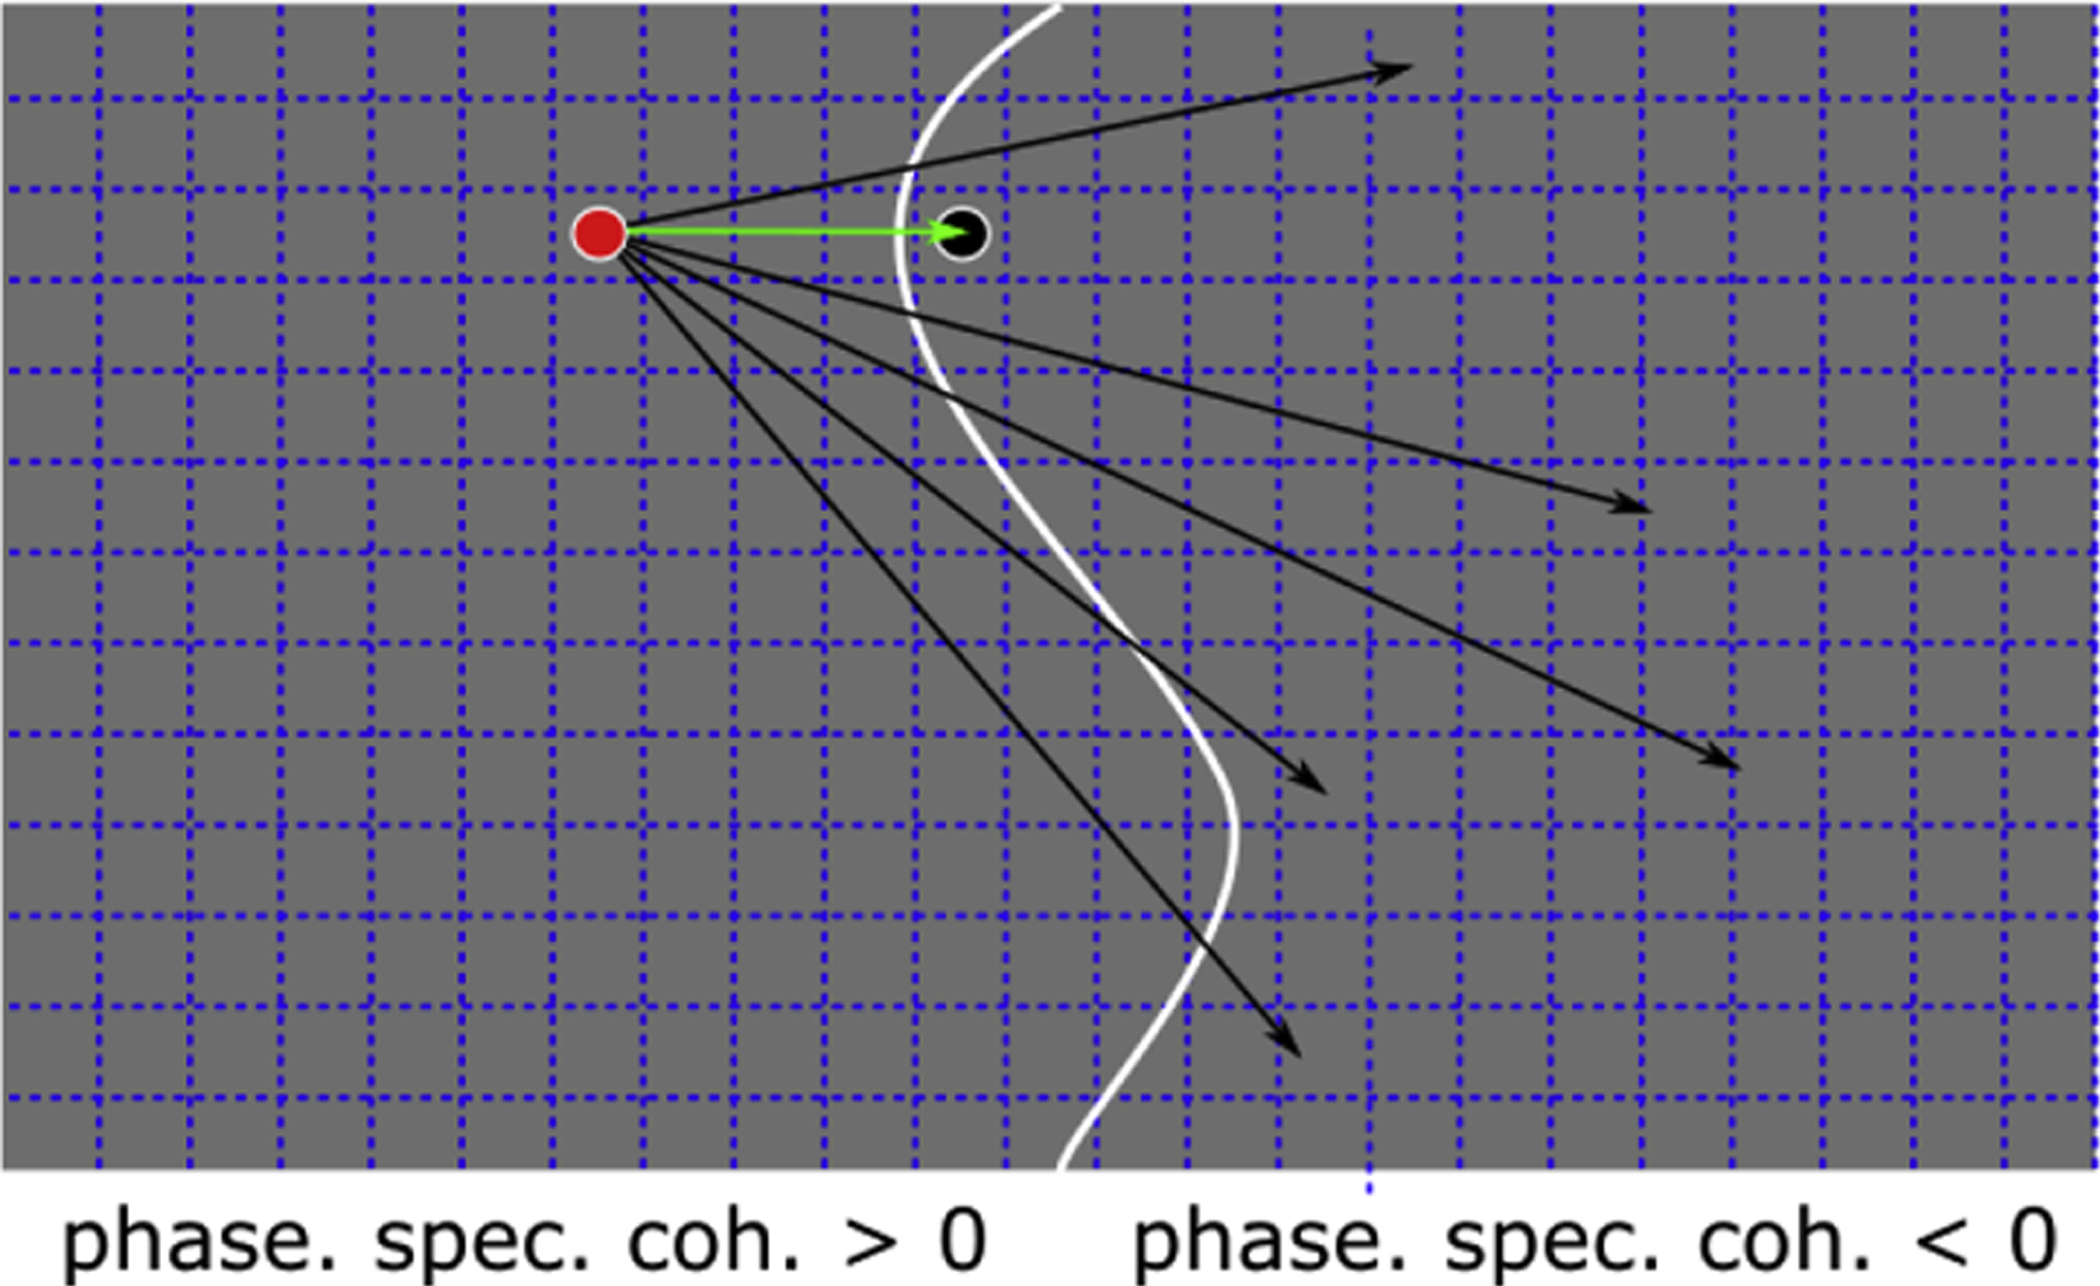
Figure 3.

Computing the geodesic distance map (cortical distance)
The grey area depicts a portion of V2 over the cortical surface. Normally, this portion would be a two-dimensional sheet that extends in a three-dimensional space. To simplify, in this example we consider the two-dimensional sheet outlined by the grey area above. The grey area is composed by nodes, represented by the squares delimited by dashed lines. The grey area is divided into two portions (two consecutive stripes), where the phase specified coherence is larger than 0 and smaller than 0, respectively. The border between these two portions is identified by the white line and it divides ‘positive nodes’ form ‘negative nodes’). We computed the geodesic distance from every node in the positive group to every node in the negative group. For each node from the positive group, we assigned the smallest distance among all the possible geodesic distances computed. In the example above we highlight one node among all the positive nodes (red dot) and several distances to negative nodes (arrows). The smallest distance computed from the red dot is represented by the green arrow. We assign the distance depicted by the green arrow to the red node. To obtain a complete geodesic distance map, we repeat the same operation for all positive nodes and negative nodes.
