
Figure 5,
Modelling the GE-BOLD PSF
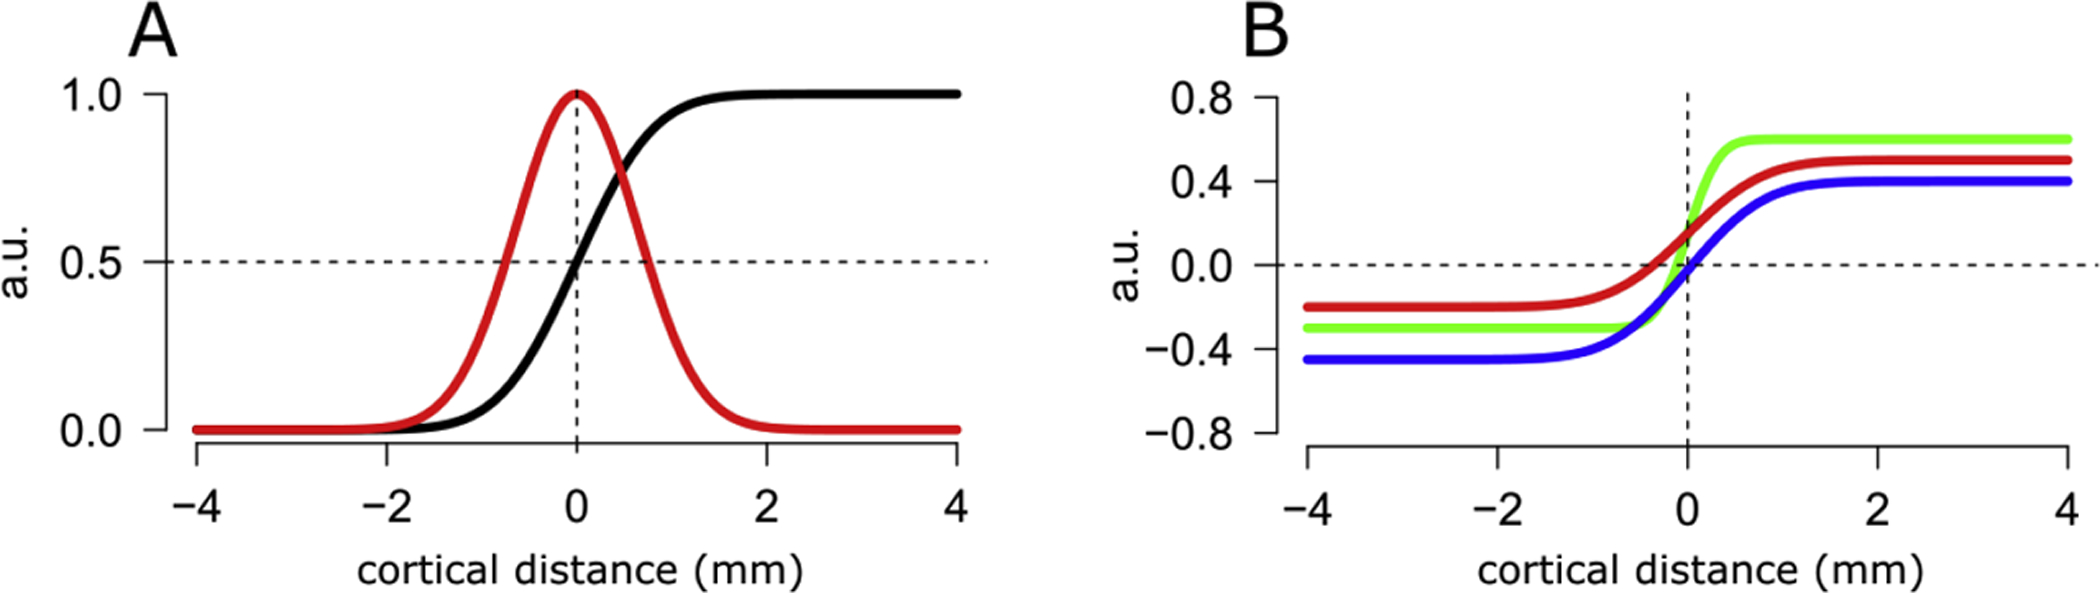
Panel A. The plot shows a Gaussian PSF (red line). We used the cumulative of the Gaussian (black line, (CGF)) to fit a model to the measured phase-specified coherence along cortical distance, for each surface along cortical depth. Panel B. We modified the parametrization of the standard CGF: we fixed the location parameter (μ) to zero (at the boundary between two successive stripes in human V2); we added a scaling parameter, to account to different amplitudes of the signal; we added a shift parameter to accommodate the range of phase specified coherence [−1, 1], see Eq. 4. The plot shows three CGFs with different parameters: green line: FWHM=0.6mm, scaling parameter: 0.9, shift parameter: −0.3. blue line: FWHM=1.5mm, scaling parameter: 0.85, shift parameter: −0.45. red line: FWHM=1.5mm, scaling parameter: 0.7, shift parameter: −0.2. Please note that the red and blue lines appear to have a different rate of change around the zero crossing along cortical distance, however this difference is accounted for by a difference in amplitude, not FWHM (0.85 and 0.7 for the blue and red lines, respectively). The parametrization adopted in our modelling approach allows to disentangle between different components of the trend between phase specified coherence and cortical distance, and to detect differences that could otherwise be wrongly be ascribed to FWHM alone.