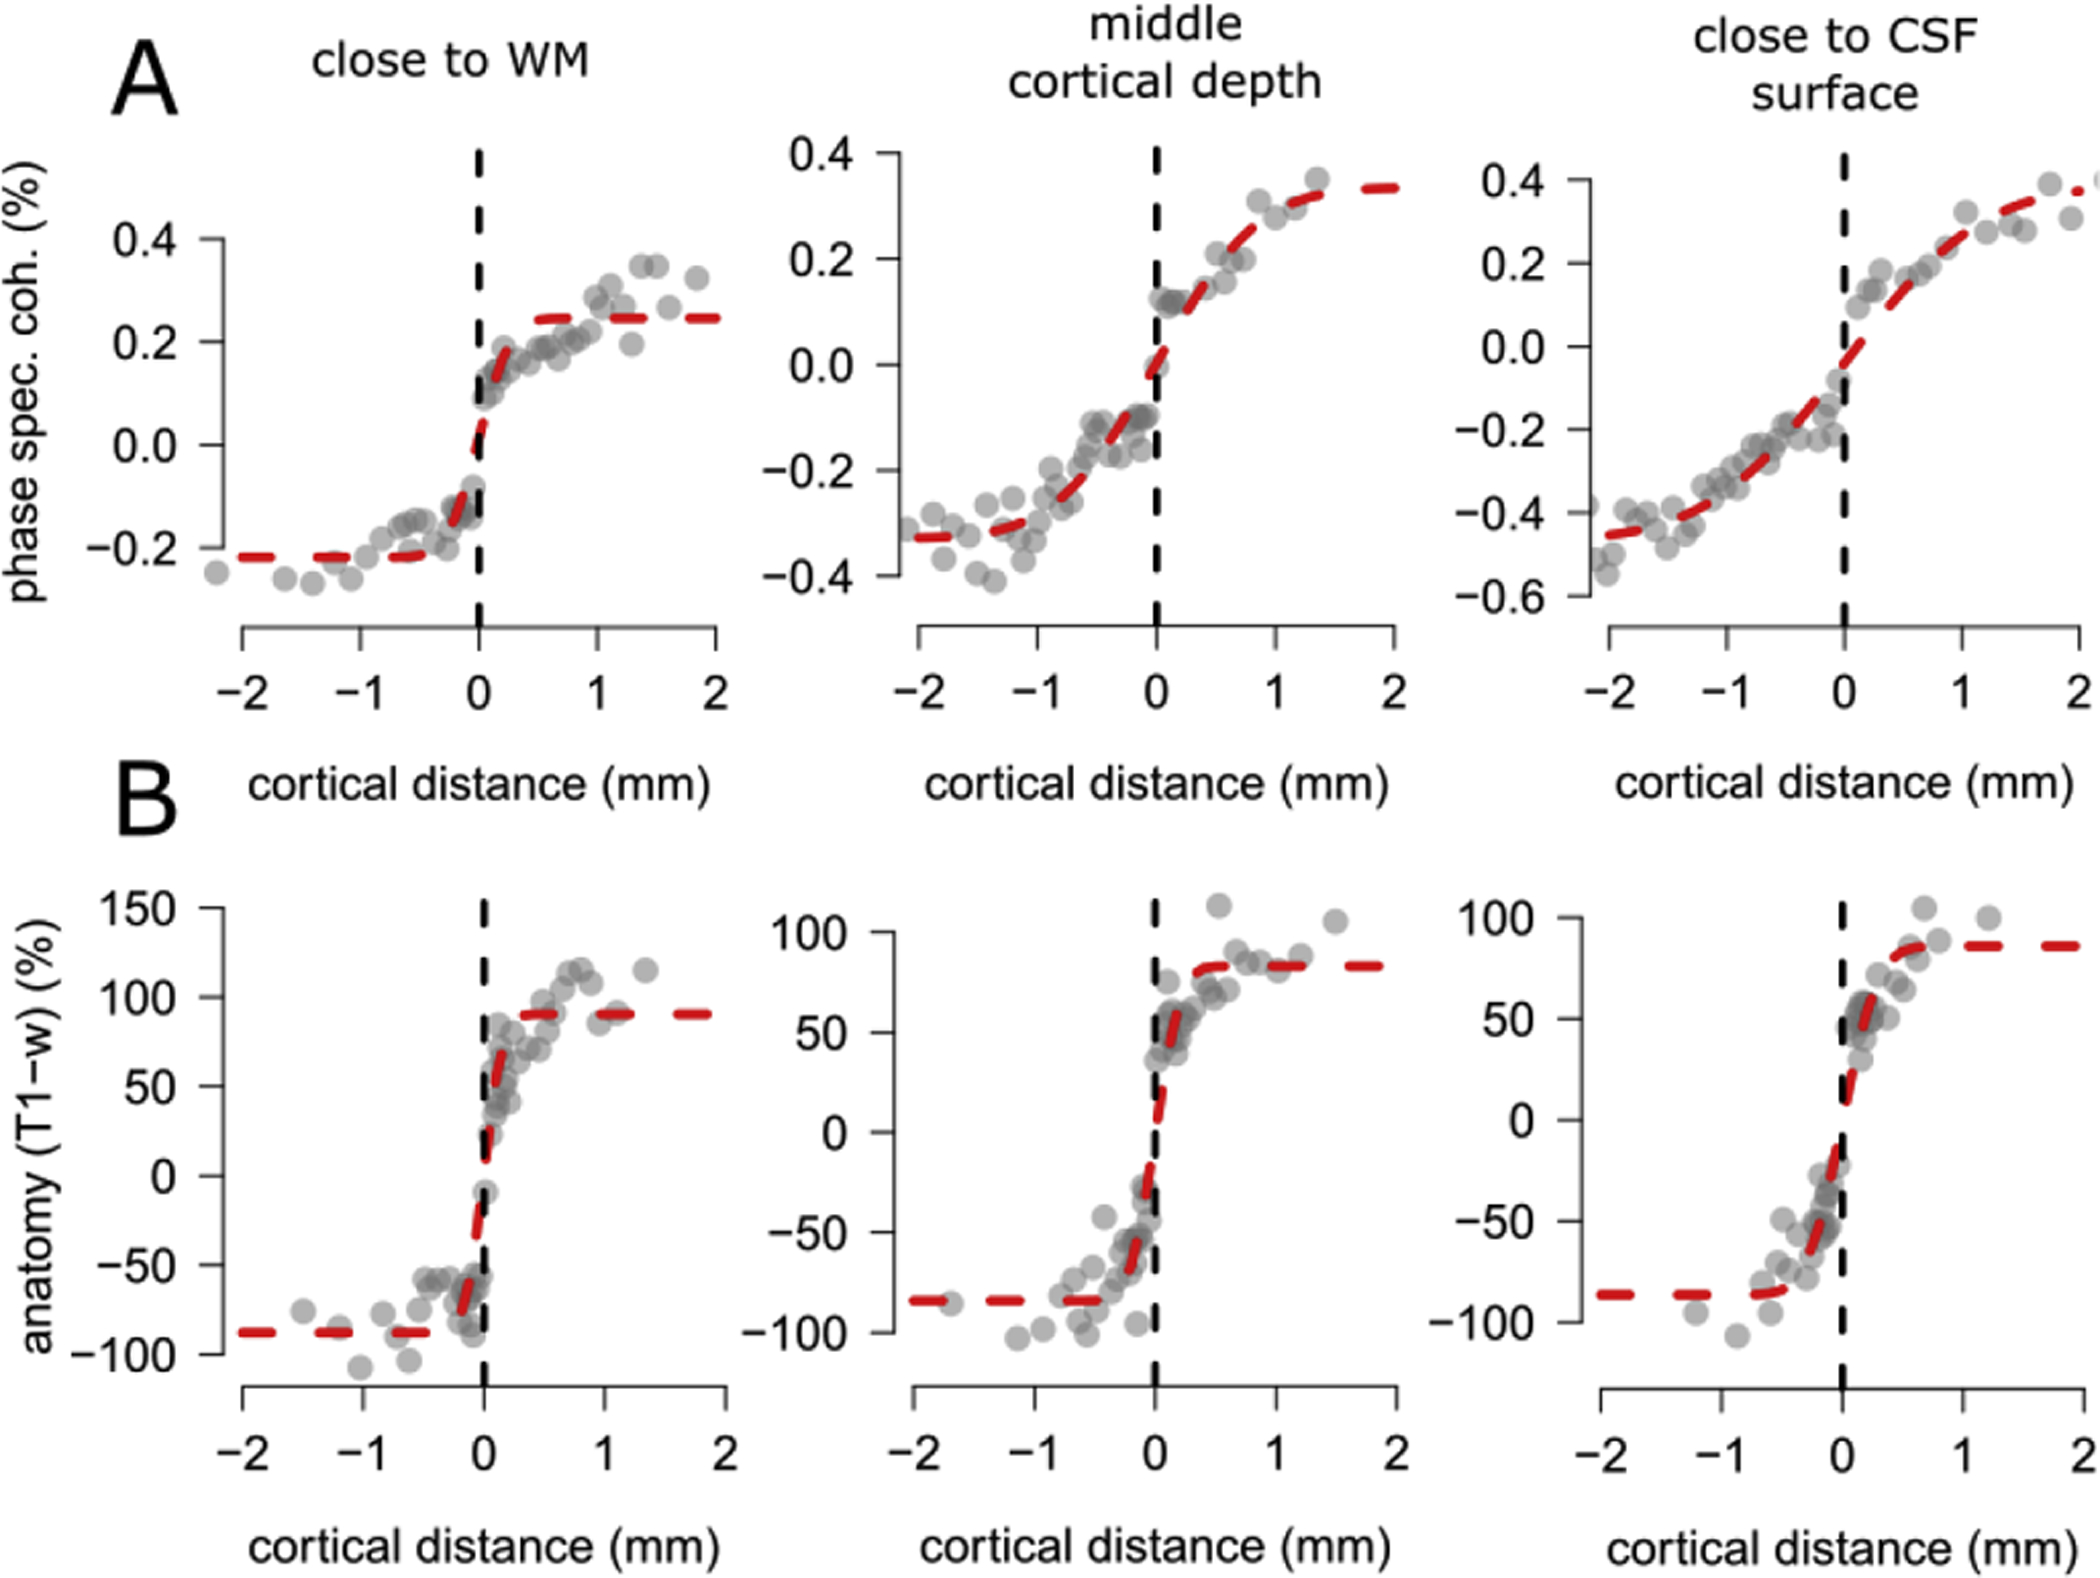
Figure 6.

Example fit from the entire V2 from one participant at three different levels along cortical depth (close to WM, around the middle of cortical depth and close to GM surface, see panel titles). Panel A: In the first row we report results from the phase specified coherence. Moving along cortical depth, from WM towards GM surface we notice a difference in the rate of change of phase specified coherence as a function of cortical distance, with a faster rate of change close to the WM and a relatively slower rate of change close to the CSF surface. Panel B: In the second row we report results from the T1-w signal. Moving along cortical depth, from WM towards GM surface we notice an approximately constant rate of change of T1-w signal as a function of cortical distance, between WM and GM surface.
