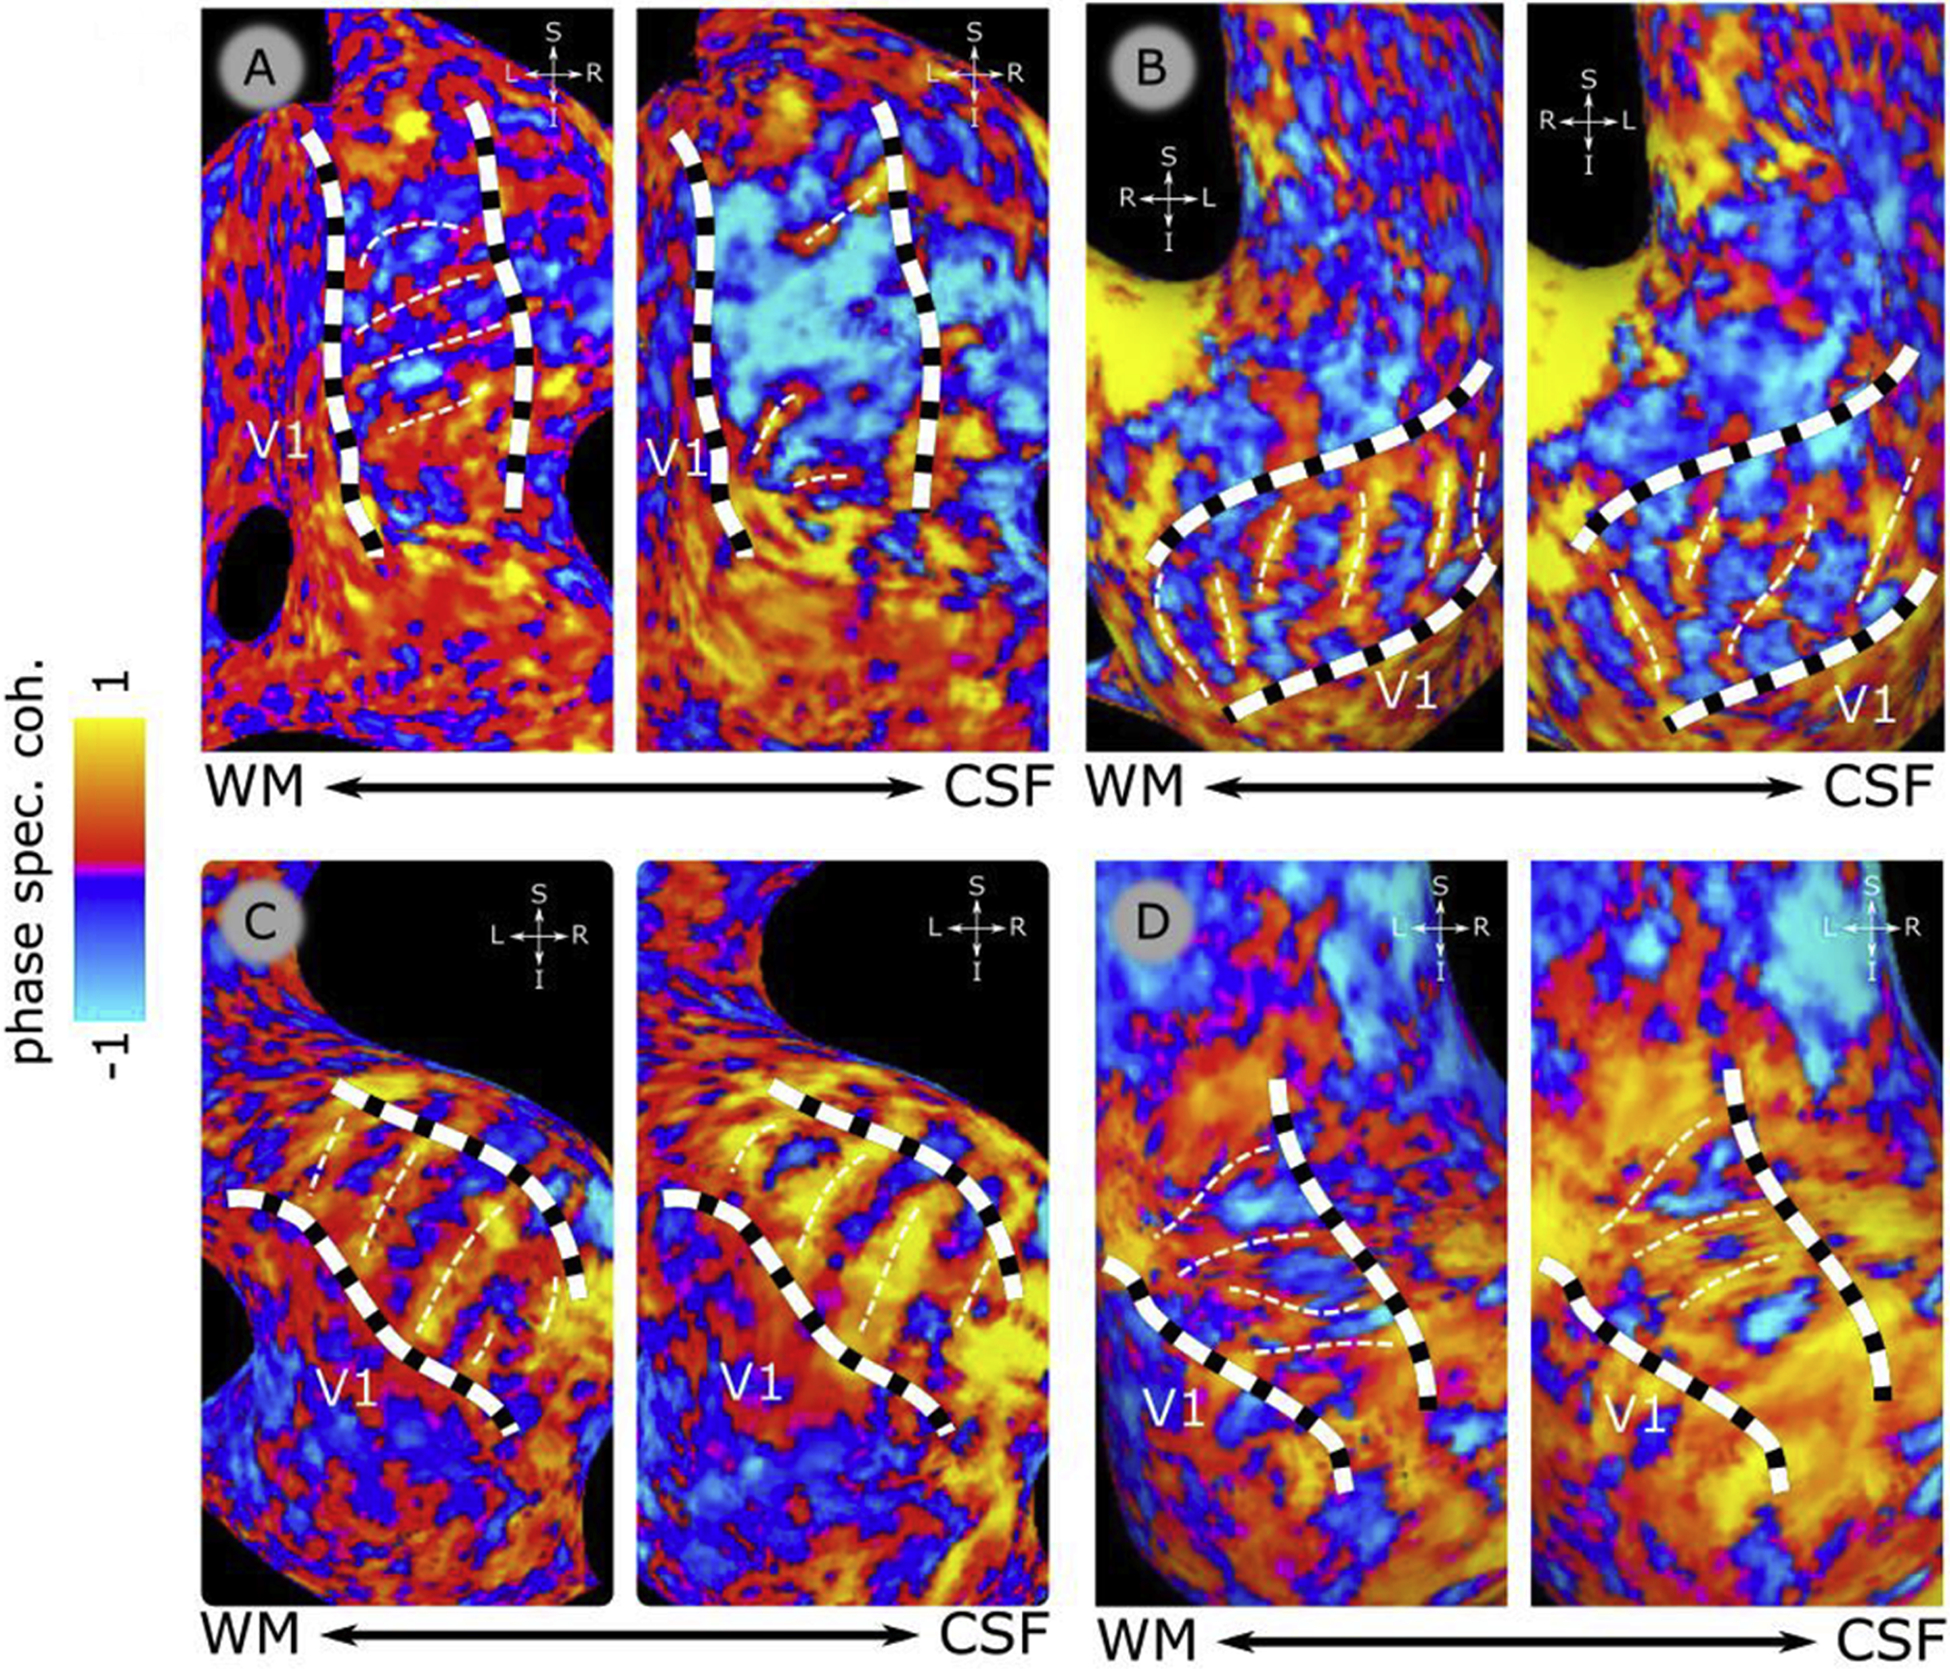
Figure 7.

Functional delineation of V2 stripe-based subdivisions. Panels A, B, C & D show phase-specified coherence responses over inflated cortical surfaces for each participant (P1–P4, respectively). On each panel, 2 inflated cortical surfaces are shown, for a location close to WM (on the left of each panel) and a location close to CSF, (on the right of each panel). Panels show the zoomed view of the dorsal occipital lobe with the identified V2 borders (dashed black and white, thick lines). The color bar indicates the phase-specified coherence values, indicating responses dominated by “fast” (7.5 Hz, blue) or “slow” (1.5 Hz, orange) temporal frequencies. White thin dotted lines indicate the manual delineation of the stripes based on the peak of 1.5hz (orange) preference. The location of primary visual cortex (V1) is indicated on each surface.
